header image
Check this page for updates on upcoming classes, our learning goals, and the lesson modules we'll use to get there.

Session Calendar and session guides

DAT-102: Introduction to Data Analytics

* The official final exam schedule for FA18 specifies a final period start time of 5:00 pm. Eric has a final at West Hills that runs until 4:30, cutting it too close with Pittsburgh traffic. We'll meet at our ordinary time of 6pm to avoid confusion.

Session guides

Guiding questions, objectives, lesson activities, and out-of-class assignment listings are available for each class session. Click "toggle full session guide" to view all the session's sections.

Monday, 10 September 2018

Whet your analytic appetite

live_helpGuiding questions

  • Data analytics: What data? How might I analyze it?
  • Is this a field that fits my interests and temperaments?

check_circleLearning Objectives

  • Discuss example questions, skills, and competencies assocaited with each of the three core domains of Data Analytics: Stats, domain knowledge, programming

arrow_upwardback to schedule


Monday, 17 September 2018

Types and representations of data

live_helpGuiding questions

  • In what ways are the methods we store data in computers similar to the ways we interpret data as humans?
  • How can the same data be stored and represented in different ways?

check_circleLearning Objectives

  • Describe and provide examples of data sources, types, and structures
  • Describe and demonstrate a conversion of data from text to decimal to binary and back again using existing conversion tools.
  • Create and annotate a hierarchical tree of data types and representations
  • Create a graph and tree data structure and represent it graphically and tabularly

arrow_upwardback to schedule


Monday, 24 September 2018

Data profiles, guiding questions, and frequency distributions

live_helpGuiding questions

  • I have no idea what I'm looking at! How do you expect me to use this data set?!!??
  • How is this data set shaped?

check_circleLearning Objectives

  • Write a data profile of a given data set. [Course Learning Outcome 1]
  • Brainstorm guiding investigation questions for a dataset inside and outside your domain of expertise [CLO 1]

bookResources

listLesson sequence

  1. Creating hierarchical data and informal versions of organizational charts
  2. Developing a data set profile: Title, Synopsis, source, permissions, questions
  3. Types of questions: Descriptive (basic), deeply analytic, and predictive/inferential
  4. Crafting a data profile and brainstorming questions

playlist_add_checkMid-week ToDOs

  1. Flesh out your data profile and secure one or more spreadsheet/tabular data set related to your field of interest. Bring a digital copy of this data with you to class next week.
  2. Dust off your spreadsheet skills by creating a basic budget using the Technology rediscovery spreadsheet module 1 as a guide
  3. Review the concept of mean, median, mode, variance, and standard deviation
  4. Practice using the spreadsheet functions in your chosen tool for computing the previous metrics
  5. Be prepared for a little "spreadsheet quiz" like thing next class.
  6. Read about histograms (frequency distributions) in your chosen statistics textbook

cakeExtension exercises

For those already familiar with spreadsheet, please run the essential descriptive statistics on your variables of interest using the table you have already gathered.

arrow_upwardback to schedule


Monday, 22 October 2018

Exploring the inquiry cycle

live_helpGuiding questions

  • How are data-related questions birthed? Which persons are present? And, who trained the doctor?
  • How do management priorities interact with statistically driven conclusions?
  • Can academia help me solve my non-academic problems?

check_circleLearning Objectives

  • Ingest an academic article exploring conclusions based on statistical reasoning and map its lifecycle using our management-driven inquiry model
  • Scrutinize claims based on statisical data to identify sources of selection, response, and validity biases.
  • Classify the statistical reasoning tools employed in a given study using the McClave 2008 Taxonomy

bookResources

listLesson sequence

  1. Investigate the application of statistical reasoning and modern aviation: View clip from Flight with Denzel Washington
  2. With modern aviation serving as a gold standard of using statistics and rigorous investigation to promote transportation safety (According to the NTSB): Investigate population definitions
  3. Dutch Elm Examples

listPrimary source listing

Number In-text Full citation Access link & info
0 Chervany 1980 Chervany, N. L., Anderson, J. C., Benson, P. G., & Hill, A. V. (1980). A Management Science Approach to a Dutch Elm Disease Sanitation Program. Interfaces, 10(2), 108–114. Retrieved from https://ezproxy.ccac.edu/login?url=https://search.ebscohost.com/login.aspx?direct=true&db=bth&AN=6692483&site=eds-live Access through CCAC libraries
1 Kozak 2015 Kozak, M., Krzanowski, W., Cichocka, I., & Hartley, J. (2015). The effects of data input errors on subsequent statistical inference. Journal of Applied Statistics, 42(9), 2030–2037. https://doi-org.ezproxy.ccac.edu/10.1080/02664763.2015.1016410 Access through CCAC libraries
2 Bille 2013 Billé, R., Kelly, R., Biastoch, A., Harrould-Kolieb, E., Herr, D., Joos, F., … Gattuso, J.-P. (2013). Taking Action Against Ocean Acidification: A Review of Management and Policy Options. Environmental Management, 52(4), 761–779. https://doi-org.ezproxy.ccac.edu/10.1007/s00267-013-0132-7 Access through CCAC libraries
3 Strayer 2013 David L. Strayer, Joel M. Cooper, Jonna Turrill, James Coleman, Nate MedeirosWard, and Francesco Biondi (University of Utah). Measuring Cognitive Distraction in the Automobile (June 2013). AAA Foundation for Traffic Safety Free online PDF via AAA Foundation
4 Sugianto Arif Sugianto, Reza Jaya Wardhana, Nanang Yulian, I Gede Kusuma Jaya Wardana, Muchtar Karokaro4,Hariyati Purwaningsih. Failure Analysis of a First Stage High Pressure Turbine Blade in an Aero Engine Turbine on PK-GSG Boeing B747-400. Undergraduate Paper. ITS Free online PDF via its.ac.id. Also see NTSB full report on AA383 engine failure
5 Maecker 2016 Maecker, O., Barrot, C., & Becker, J. (2016). The effect of social media interactions on customer relationship management. Business Research, 9(1), 133–155. https://doi-org.ezproxy.ccac.edu/10.1007/s40685-016-0027-6 Access through CCAC libraries

playlist_add_checkMid-week ToDO: Assignment 1

  1. With the help of a librarian or data expert, select an academic article which provides a statistical analysis of an area of interest with respect to your projects.
  2. Print the article.
  3. Digest the abstract/summary of the article. Read the first few sentences of each section. Read the conclusion. Review the flow chart. Read it more carefully again. As you read, annotate the paper for the following:
    • Managerial concerns
    • Managerial questions
    • Statistical questions
    • Statistical analysis techniques
    • Statistical claims
    • Managerial answers
    • Managerial implementation
  4. Recreate your own version of the inquiry cycle as discussed in class either by hand, on a computer, or both. Create a reader-friendly digestion of each step in the cycle drawn from your article or inferred using available resources.
  5. Locate an artifact related to one of the stages in your study and prepare to discuss it and your article with your peers next week at the beginning of class next week. Prepare by brainstorming 2-3 discussion questions related to our course content. Examples of artifacts include:
    • An accompanying agency report related to the statistical data somehow
    • A news story reporting on either the statistics themselves or an event about which the data relate.
    • A summary of a personal experience or condition of your own
    • Notes from a discussion of a subject matter expert you know or found in the area
    • Notes from background research you did on the subject
  6. Package your work for sharing by creating the following files:
    • A word processing document citing your academic article and artifact with links to Internet versions if possible. Please make note of access restrictions (i.e. you must log in to MyCCAC to get full PDF, etc.)
    • A digital copy, photographed, or scanned version of your inquiry process diagram based on your article

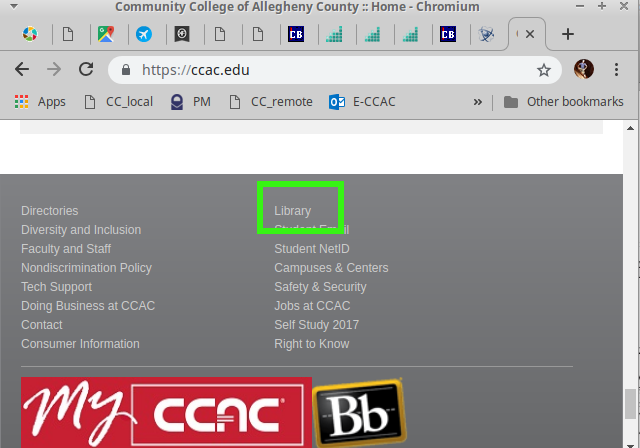
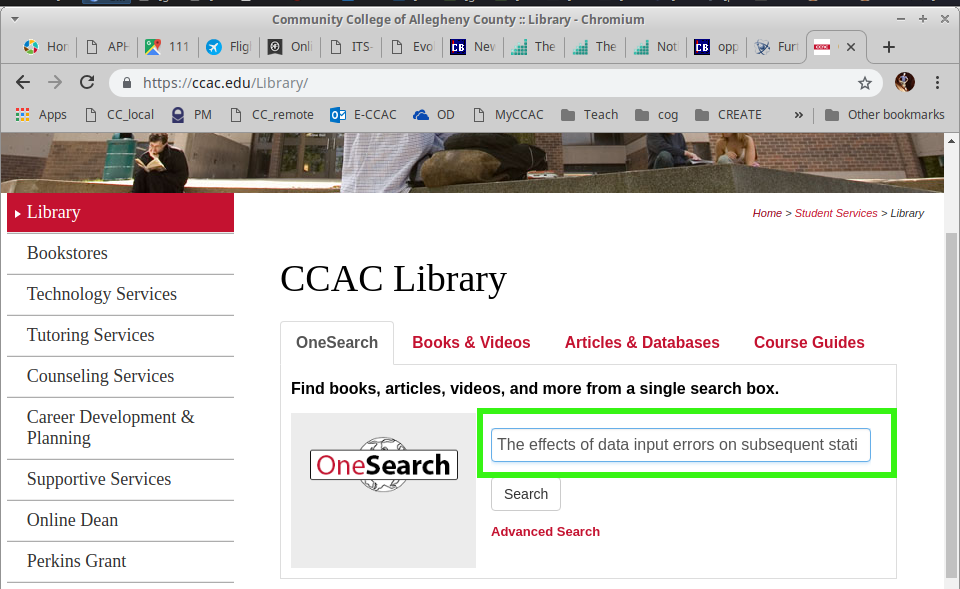
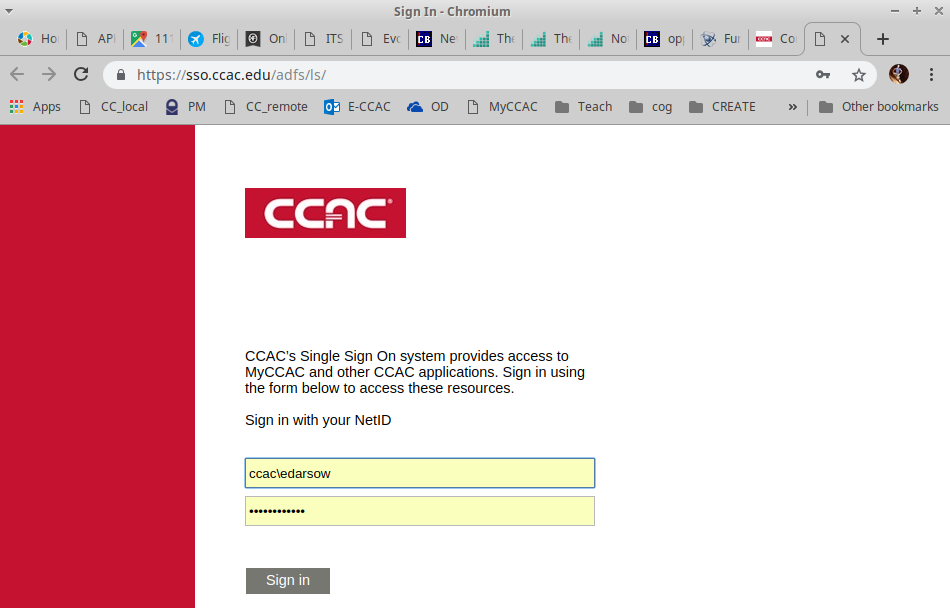
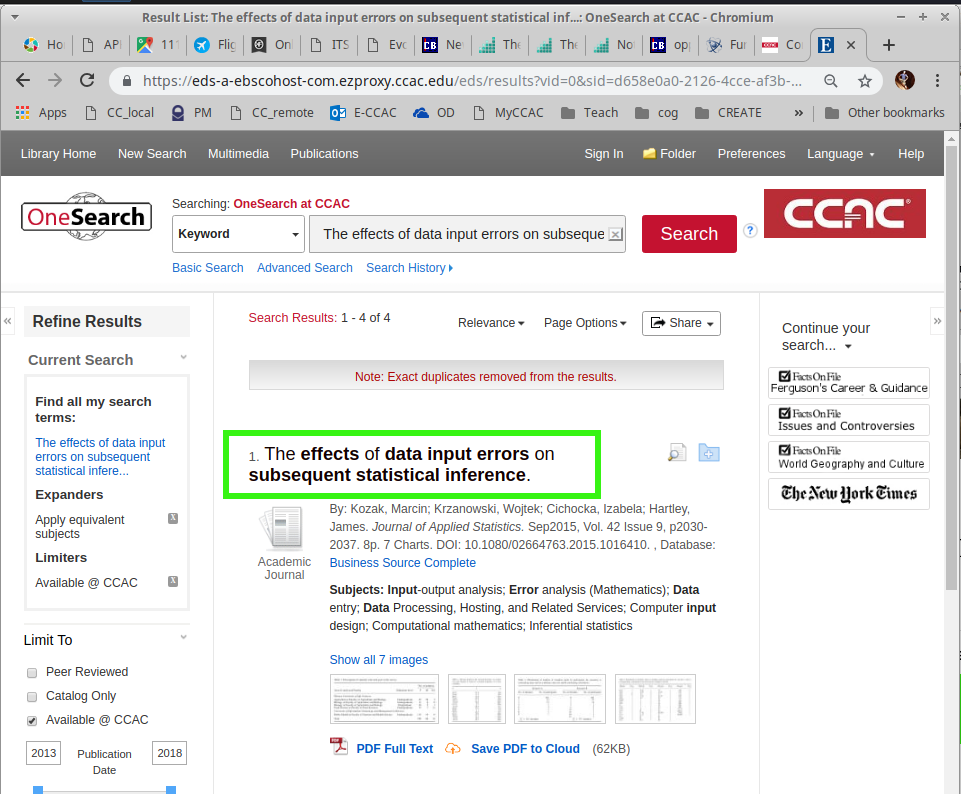
sendFinding and citing academic journal articles at CCAC

Step 1: Naviate to the CCAC libraries home page

source locator steps

Step 2: Use OneSearch

source locator steps

Step 3: Login

source locator steps

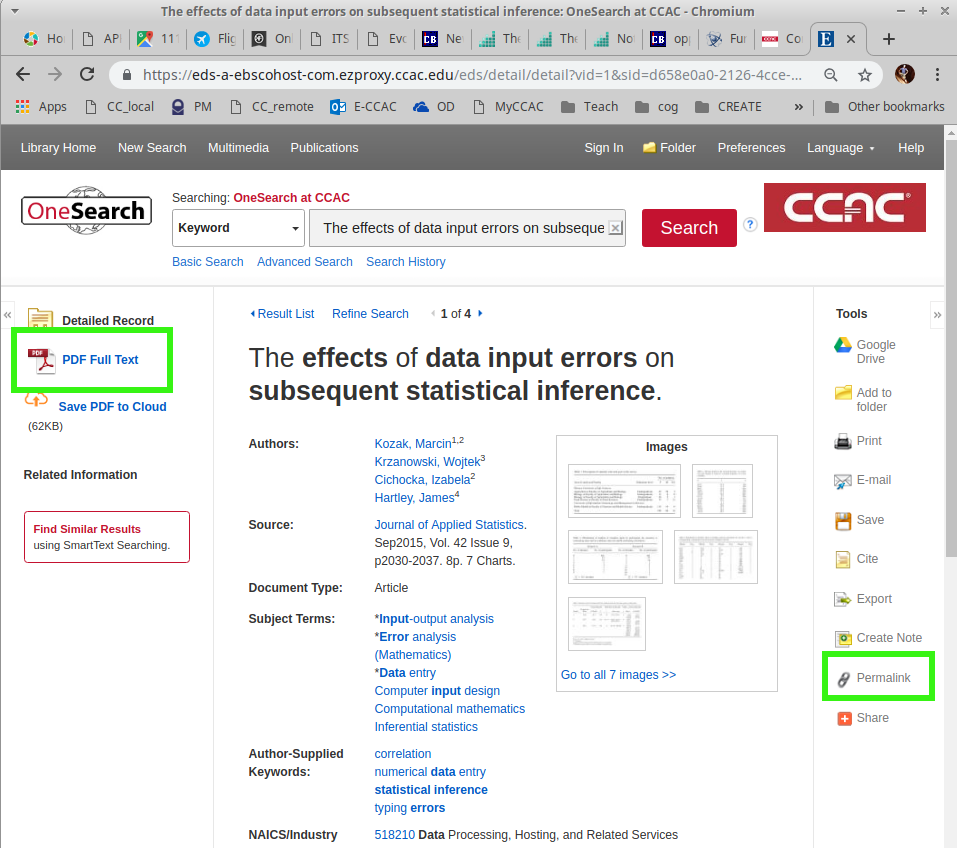
Step 4: Click on the article title to pull up the full listing

source locator steps

Step 5: Access the full PDF, grab the permalink

source locator steps

sendReference Diagrams

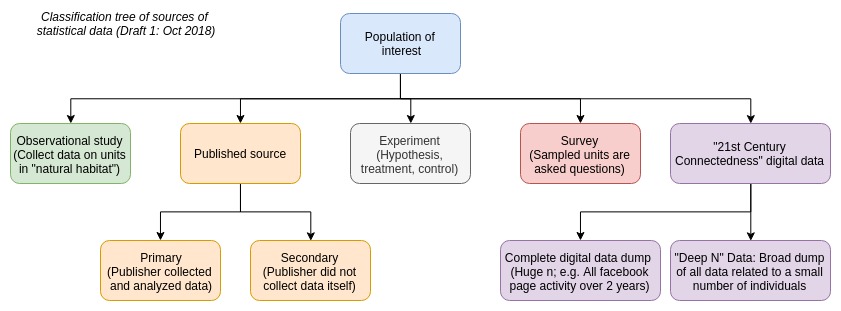
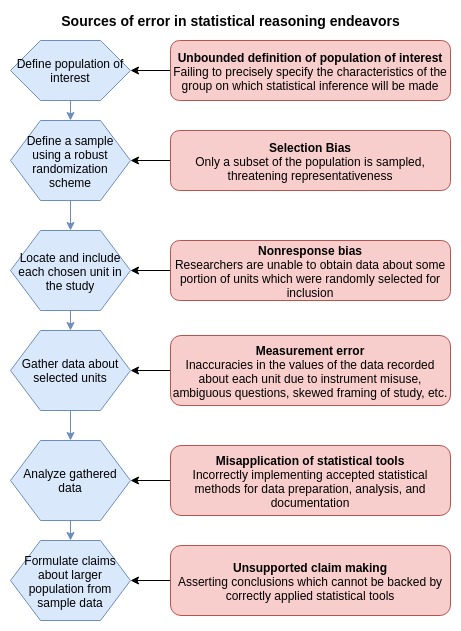
Download the PDF of these two images for references:

Classification tree of sources of statistical data

sources of statistical error

Sources of error in statistical inquiry

sources of statistical error

arrow_upwardback to schedule


Monday, 29 October 2018

Data type classifications and error sources

live_helpGuiding questions

  • What makes one data-based, peer-reviewed journal article different from another?
  • Which statistical errors are most likely to exist along each phase of the data-based inquiry process?

check_circleLearning Objectives

  • Extract managerial and statistical questions, analytical techniques, and stats-backed claims from a documented statistical study
  • Classify a given journal article according to the CCAC Data Analytics tree of data classification

bookResources

straightenNote card diagnostic

listLesson sequence

  1. Note card diagnostic: Ida Mae Darsow's professional skills inventory
  2. Round-robin sharing of articles and artifacts from last week
  3. Data tree classification introduction: Tree structure and leaf categories
  4. Classifying sample articles from last week
  5. Work time: Classify your article, double check inquiry cycle extractions with peers, and build feature article banner
  6. Break
  7. Introduction to error in statistical studies: Stanley Milgram's experiments (Youtube link)
  8. Exploration of two key factors to defend generalization of results: 1) "large N" and 2) random selection from population of interest
  9. Rating potential error sources in existing articles
  10. Identifying and rating error sources in chosen article
  11. Graphically depicting relative weightings of error sources by article

playlist_add_checkMid-week TODOs

This week's TODOs invite your to consider the generalizability of two or more journal articles assembled for last class in addition to your selected journal article related to your topic.

Step 1-Setup: Create your data gathering tool using the following empty table as a guide

Article citation Population of interest Large N? Randomization? Assessment of generalizability
Article X from last week
Article Y from last week
Your own article

Step 2 - Learn about Central Limit Theorem: Dig out the statistics text your bought for this class. Look up the Central Limit Theorem (used in calculus) and read about the criteria required for making statistical inference based on sample data.

Step 3 - Classify: Dig into your chosen article and two articles from the previous week to assess for random draws from the population of interest and sufficiently large n.

sendProducts

A thoughtfully completed data table from the midweek TODO assessment of 3 journal articles

cakeExtension exercises

arrow_upwardback to schedule


Monday, 12 November 2018

Exploring the US Census Opportunity Atlas

We began investigating the US Census's American Community Survey on Monday, 5 November by poking around in result tables in their most simple, online-displayed form only. Many deeper and more illuminating ways exist to explore ACS and US Census data, such as the Opportunity Atlas--A tool designed by the US Census stats team partnered with researchers at Harvard University.

check_circleLearning Objectives

  • Strategically assemble dataset filters in the Opportunity Atlas which illuminate answers to inquiry questions
  • Critically react to sociologically relevant data patterns

listLesson sequence

arrow_upwardback to schedule


Monday, 10 December 2018

Final project design and collaboration

live_helpGuiding questions

  • What is my core question?
  • What data supports my inquiry?

bookResources

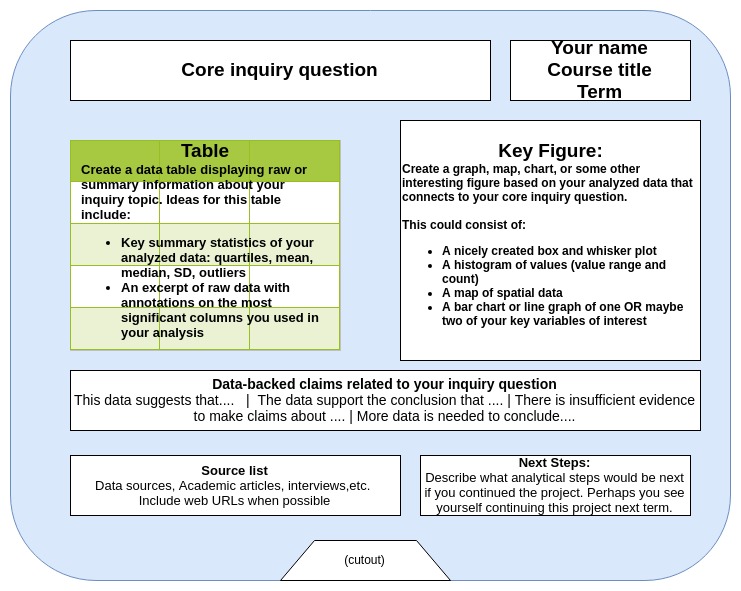
Use the following template in designing your final project display boards:

final project poster template

listLesson sequence

  1. Discuss final project development process and template
  2. Solidify inquiry question, data set, and analytic methods

sendProducts

Complete your final project display board this week and bring it, along with your data, to class on Monday, 17 December 2018 @ 6:00 pm.

arrow_upwardback to schedule