Teaching portfolio
Eric Darsow | Spring 2020
Contents*
view_array1. Academic resume
list2. Course outline
edit3. Sample assignments
code4. Sample of laboratory assignments or projects
settings5. Sample of examinations and/or written assignents
volume_up6. Summary of student survey (CCAC's SOSO results)
bar_chart7: Evidence of Professional Growth since last portfolio
border_color8: Written assessment from reviewers
school9: Information or Involvement in Assessment
group_add10: Information related to enhancing equity and diversity
public11: Service to the college and/or community
trending_up12: Statement of anticipated future professional growth
codeOptional 1: Sample of Handouts
codeOptional 2: Samples of Unsolicited Students Letters and Comments
codeOptional 3: Peer/professional observatiuon and evaulation
*Items and order enumerated by CCAC-AFL-CIO Collective bargaining agreement for period 2017-20, Contract article X.D.
1: Academic resume
view_array2: Course outline | CIT-111: Introduction to programming - Java
My courses outline are comprised of three sub-documents: the summary of standard course information, the session schedule with content URLs, and my unified grading system portal. The following link drops you in a directory listing of all my Spring 2020 syllabi and schedules as PDF documents
2.a.Course components
Syllabi for my courses reference these sections for additional details on components of their courses, such as grading.
3: Sample assignments
4: Sample of laboratory assignments or projects
5: Sample of examinations and/or written assignments
6: Summary of student survey
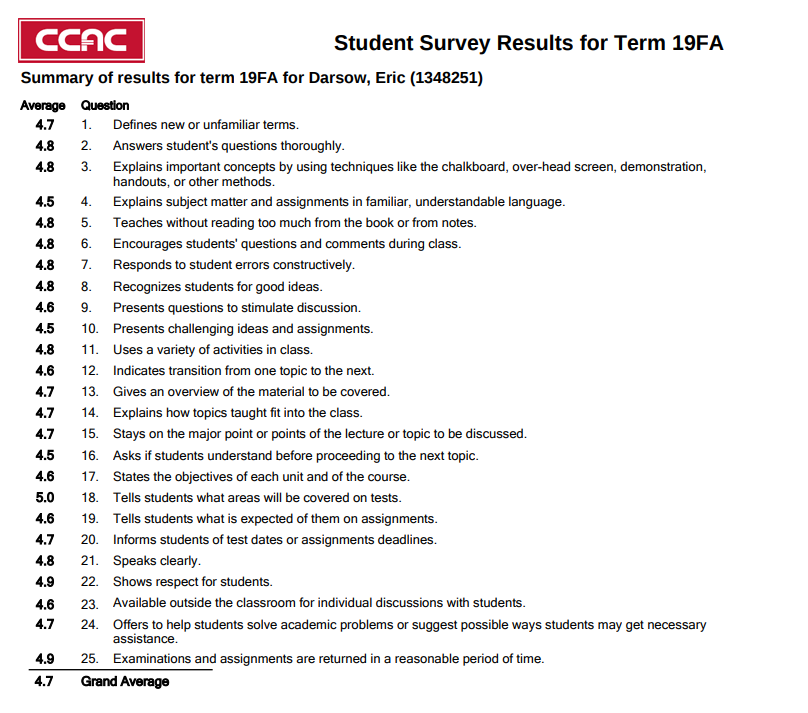
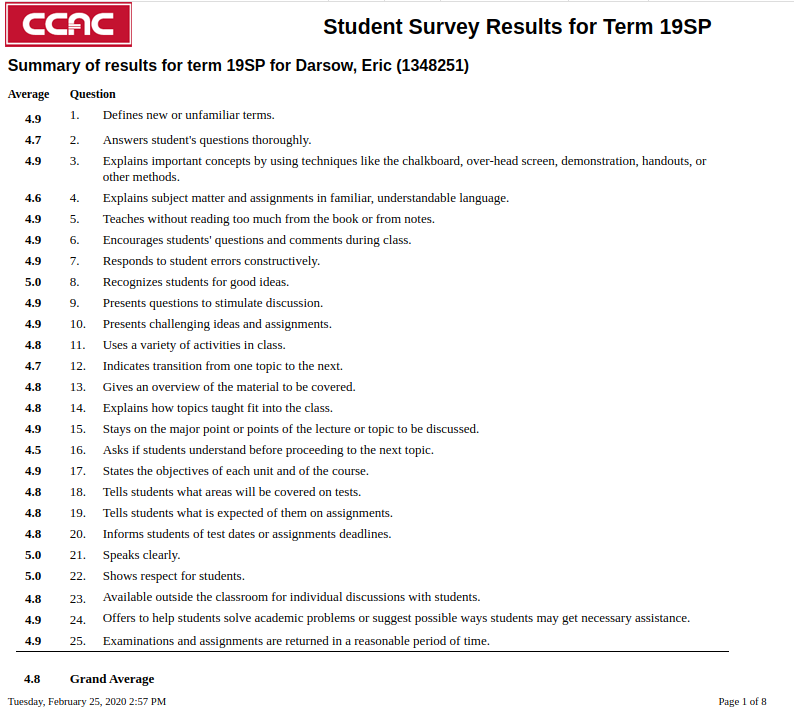
6.b.Raw SOS data for terms SP17 through FA19
The following link points to a directy listing containing all student survey documents released to me by the Community College of Allegheny County. The extent of anonymization procedures is limited to efforts undertaken in the design and administration of the survey documents and the assembly of documents released to the staff as presented here. If you believe that your identity (meaning your presence in one of these sections) can be easily derived from the data posted on this folder, please call Eric Darsow at 412.894.3020 and report the issue. The contested document will be immediately removed without challenge until a full discussion and investigation can be undertaken.
7: Evidence of Professional Growth since last portfolio
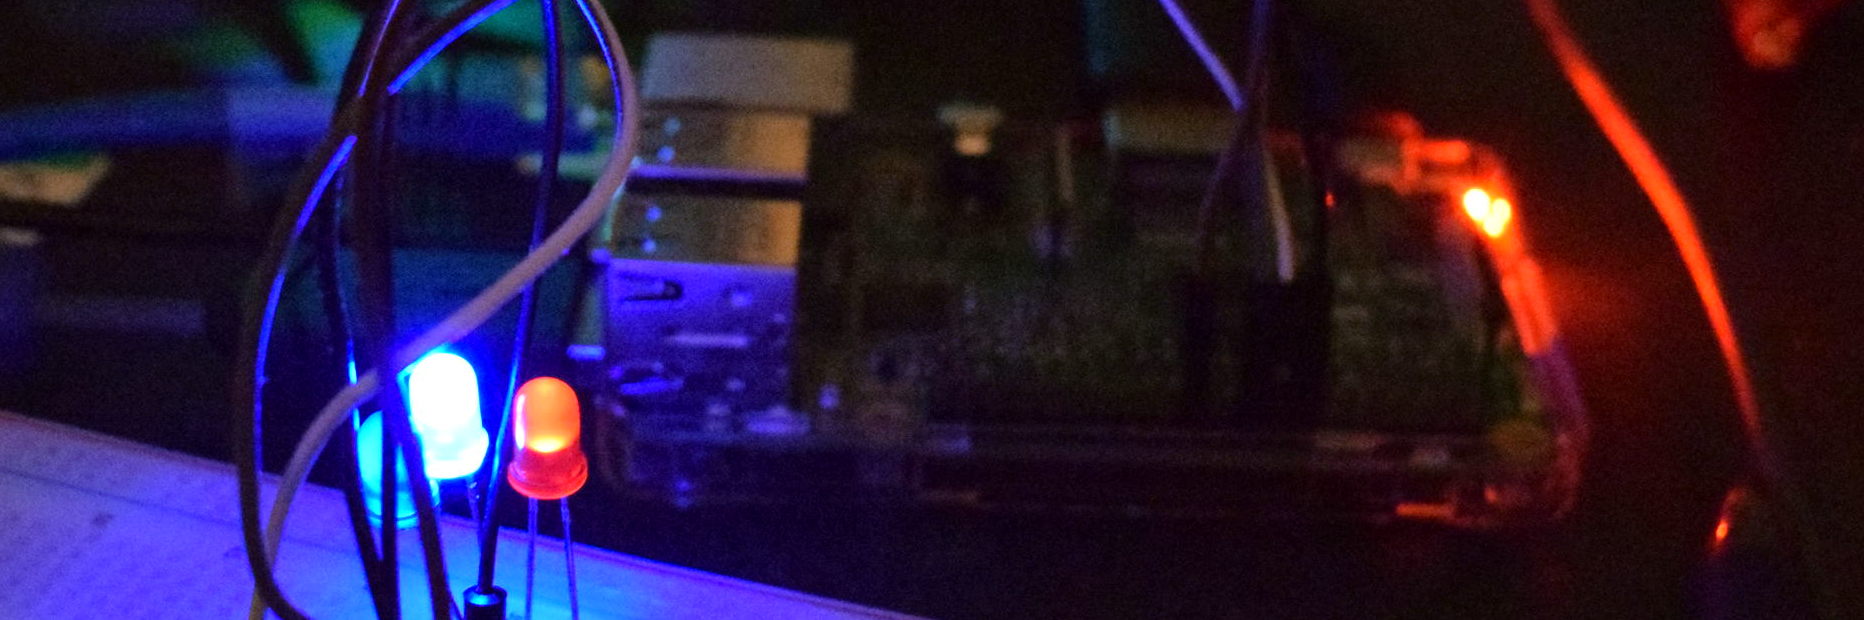
7.a.Late-stage development of portable classroom management system
Teaching at both West Hills center and North campus has necessitated the creation of a mobile classroom system allowing for easy transfer between campuses with minimal tear-down and setup. The core design features of this system are as follows:
- Containers for transport need to be rugged enough to withstand transport in an open-bed pickup and rough handling.
- Containers must be water tight for transport in Pittsburgh
- Containers should be capable of holding smaller, sub-containers for arranging categories of gear
- All gear should be labeled for recovery if lost
Evolution
My initial system involved clear interior storage bins with latching lids which worked for about a year and a half, but proved too flimsy since my main teaching crate cracked and broke with a single drop off the pickup bed.
Discovering that Harbor Freight tools retails low-priced versions of the much more expensive Pelican cases which have sturdy latches, hinges, and water-tight gaskets changed my life from a gear perspective.
7.b.Cross-course collaborative tool building
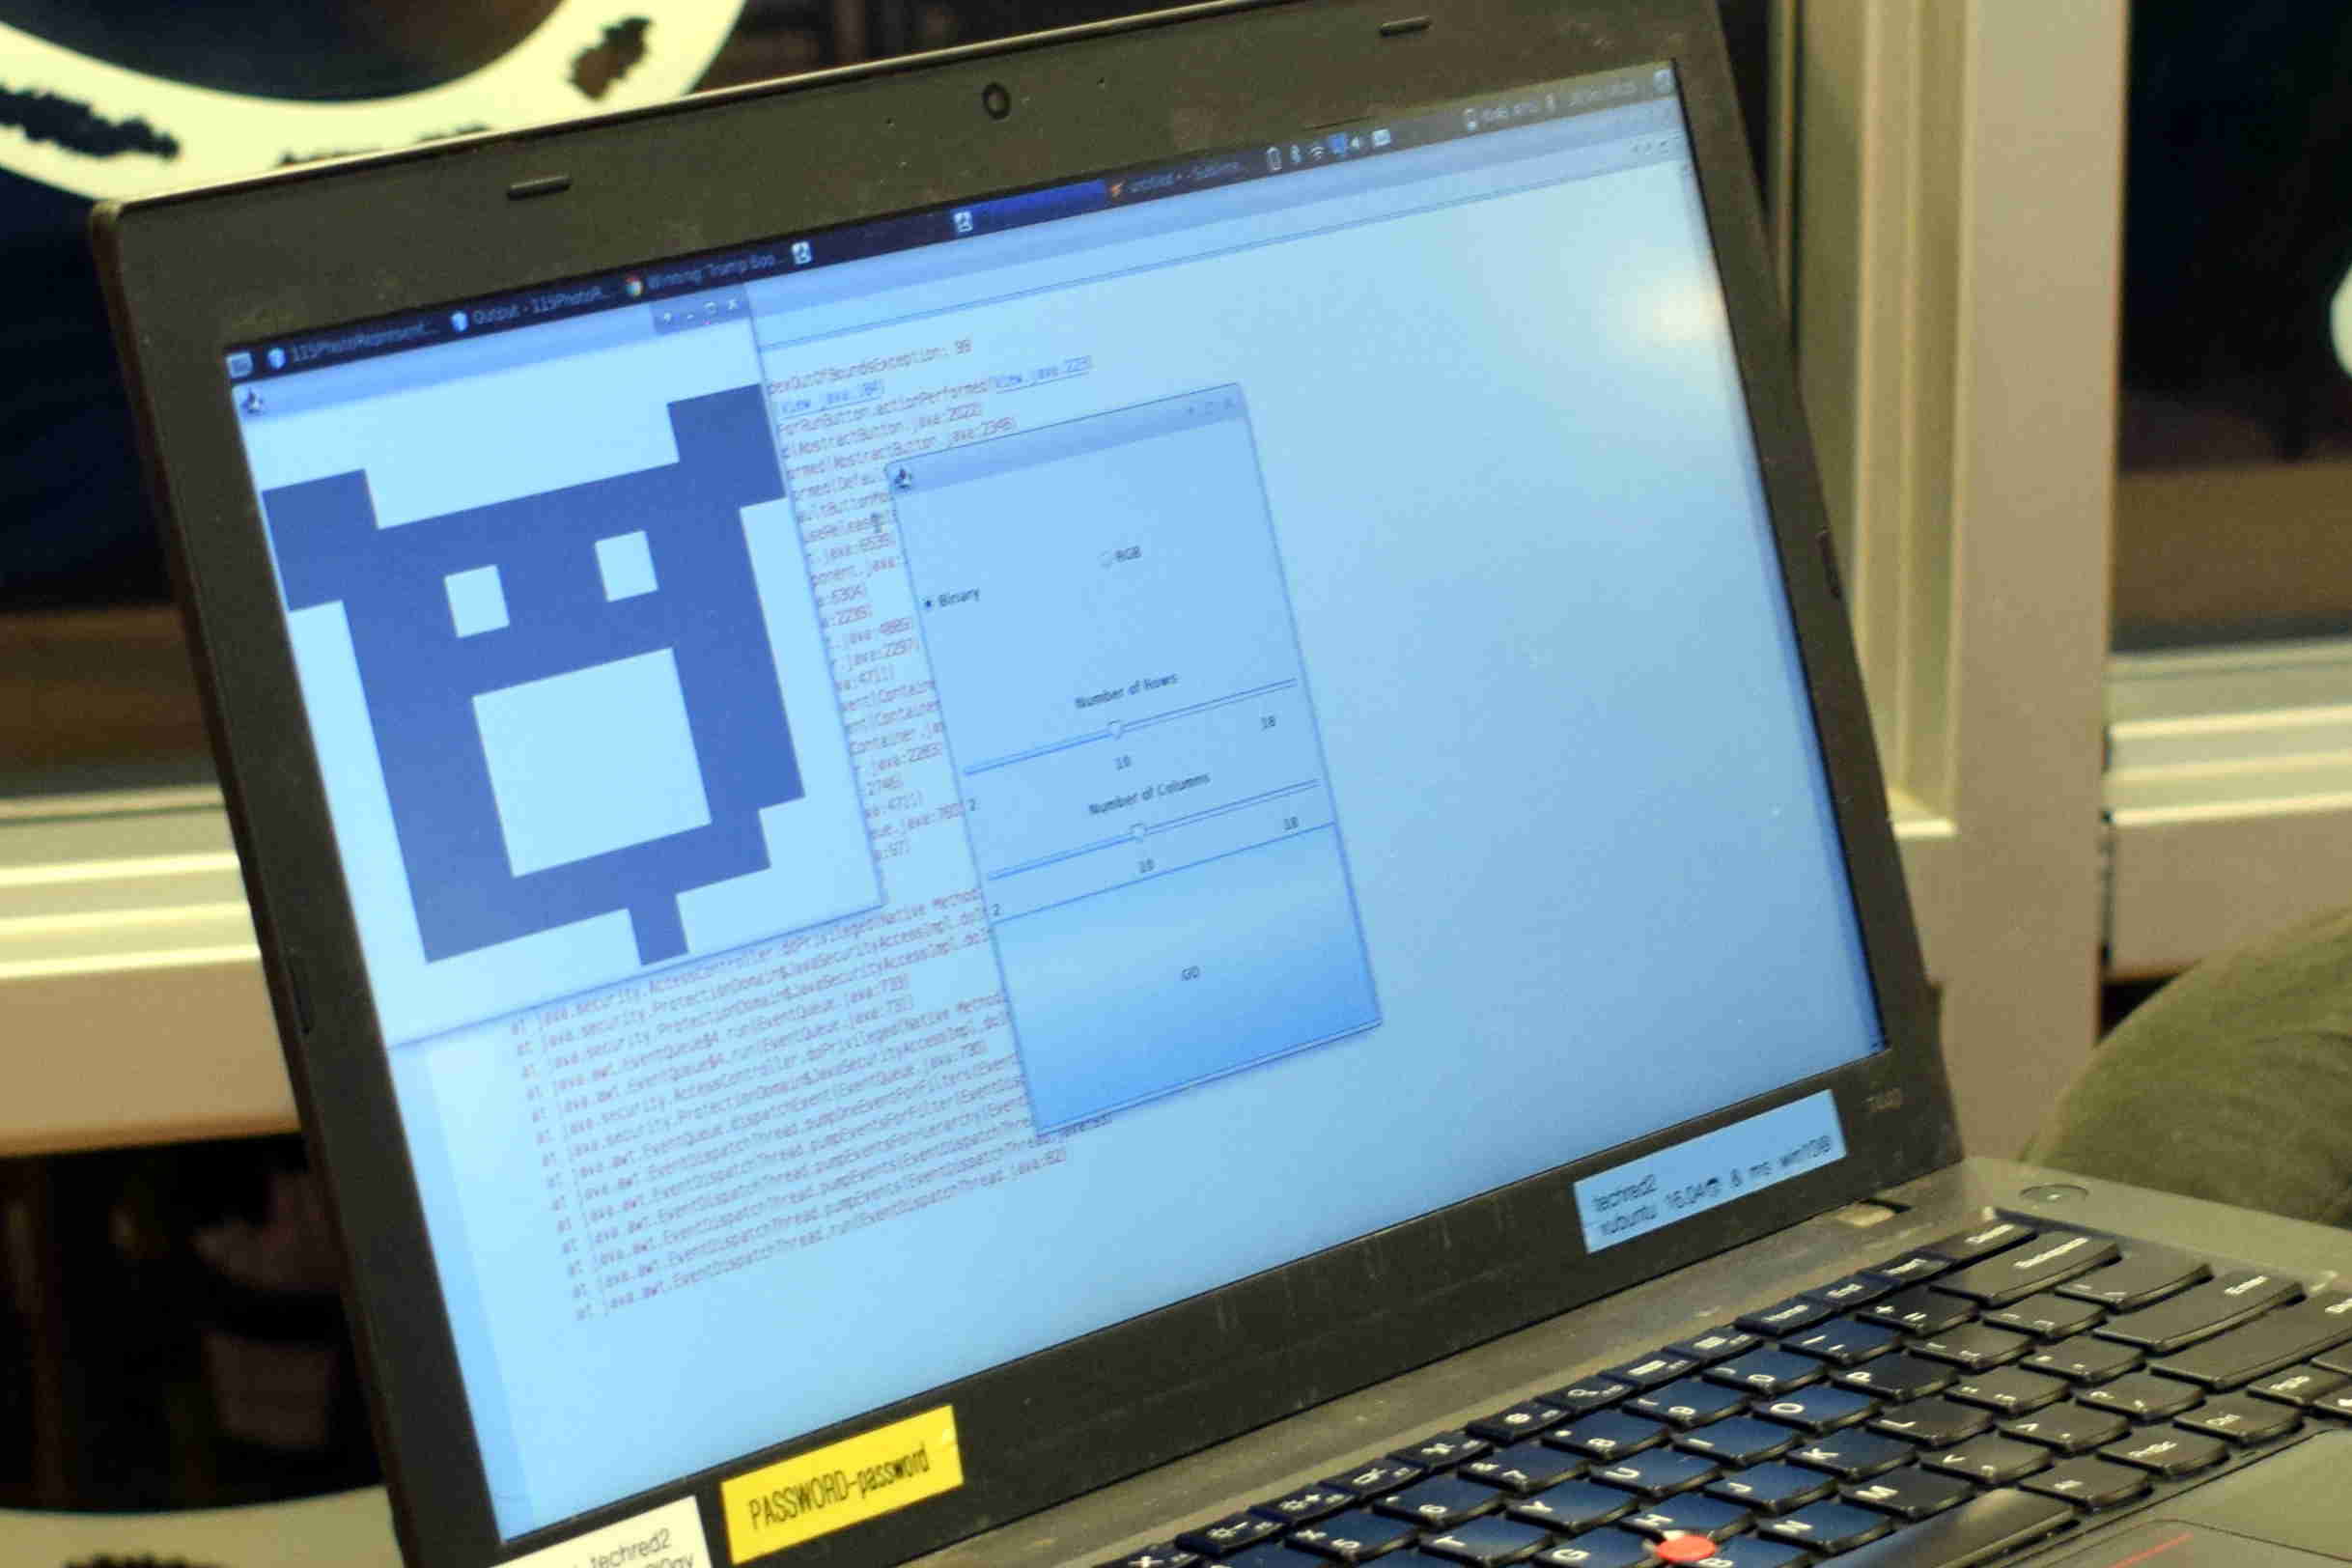
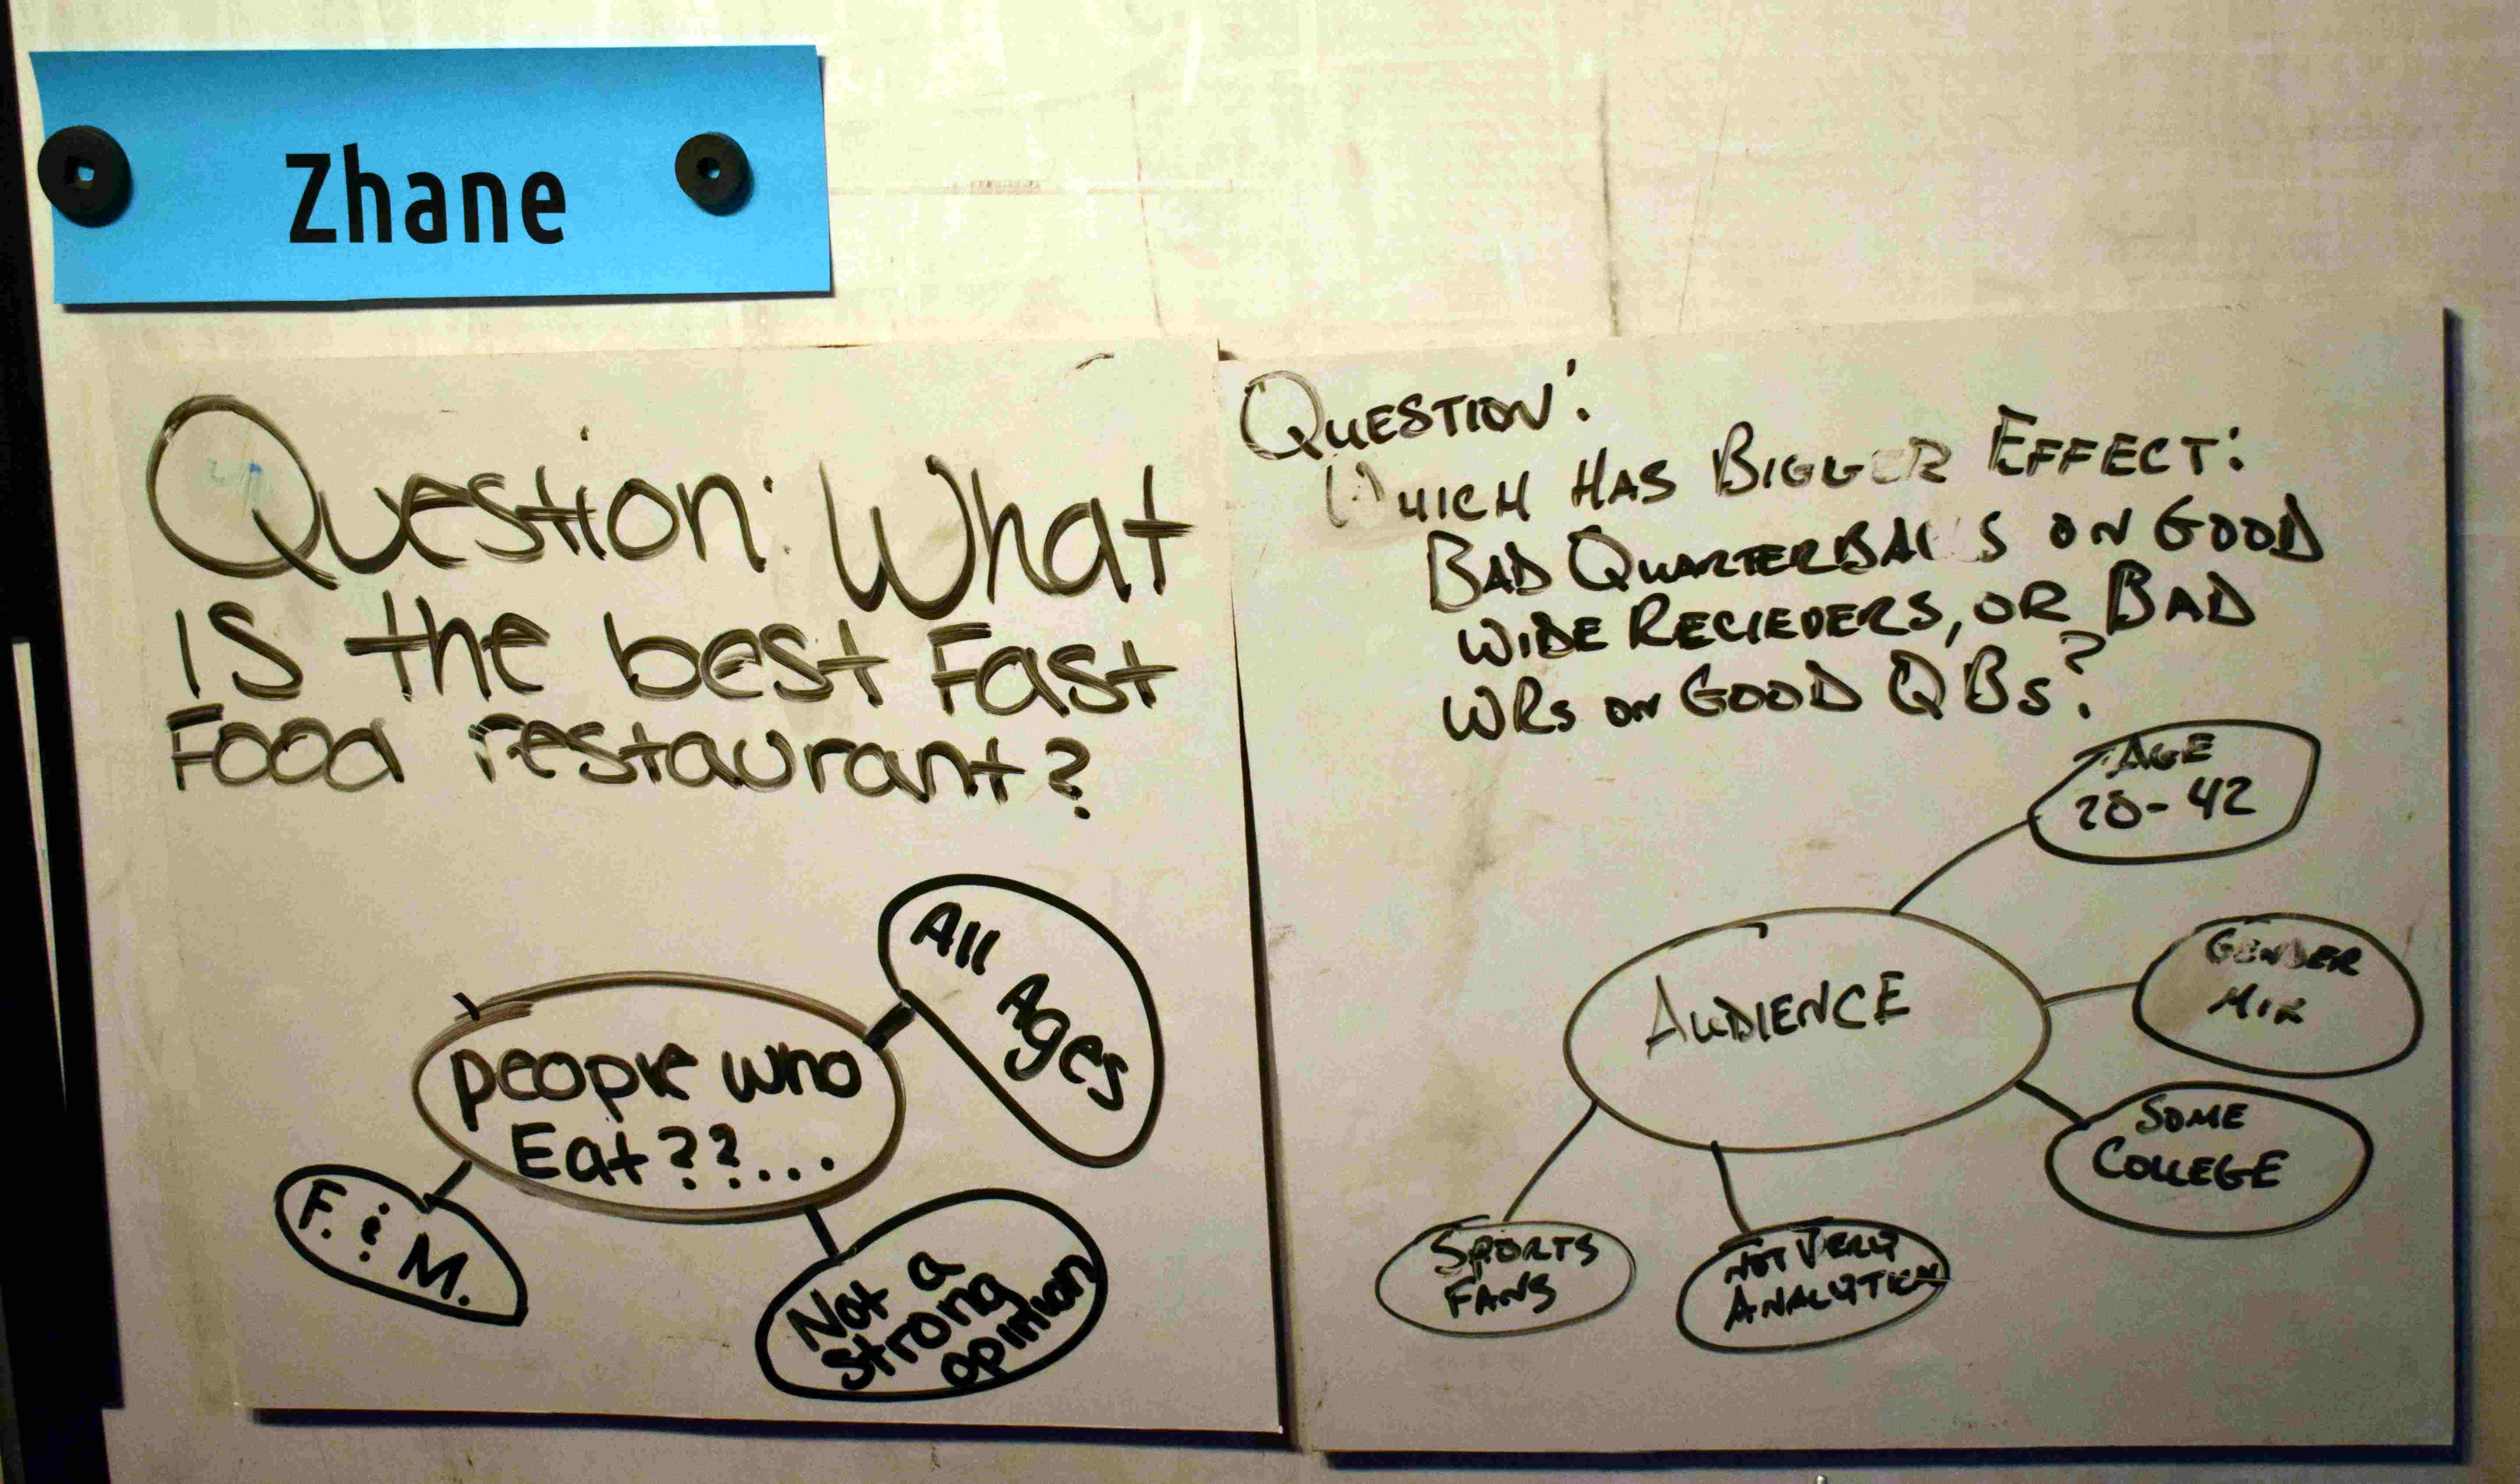
Python 2 students created programs to visualize student icons which CIT-115 students at West Hills are converting to binary.
Icons encoded in a word processor
Icons processed with python
Python 2 student Brandyn Gilbert created a tool in python during week 1 of the course which can encode and display student icons given a 100 character string of any two characters--one to signal a shaded pixel and one to signal an unshaded pixel. Click the image to visit the actual code repository and download the python for yourself!
Sample program output
Student repository listing
7.c.Human-computer interaction modeling: binary icon tape
Teaching computer fundamentals must have been easier when one could only hold about three or four vacuum tubes in one hand at a time. Now that hand-held computing is ubiquitous and students are carrying around tens of millions of transistors in their pockets, all of which are embedded on a silicone wafer and encased in dozens of s
Original icon
Encoding on custom-made binary data transfer tape
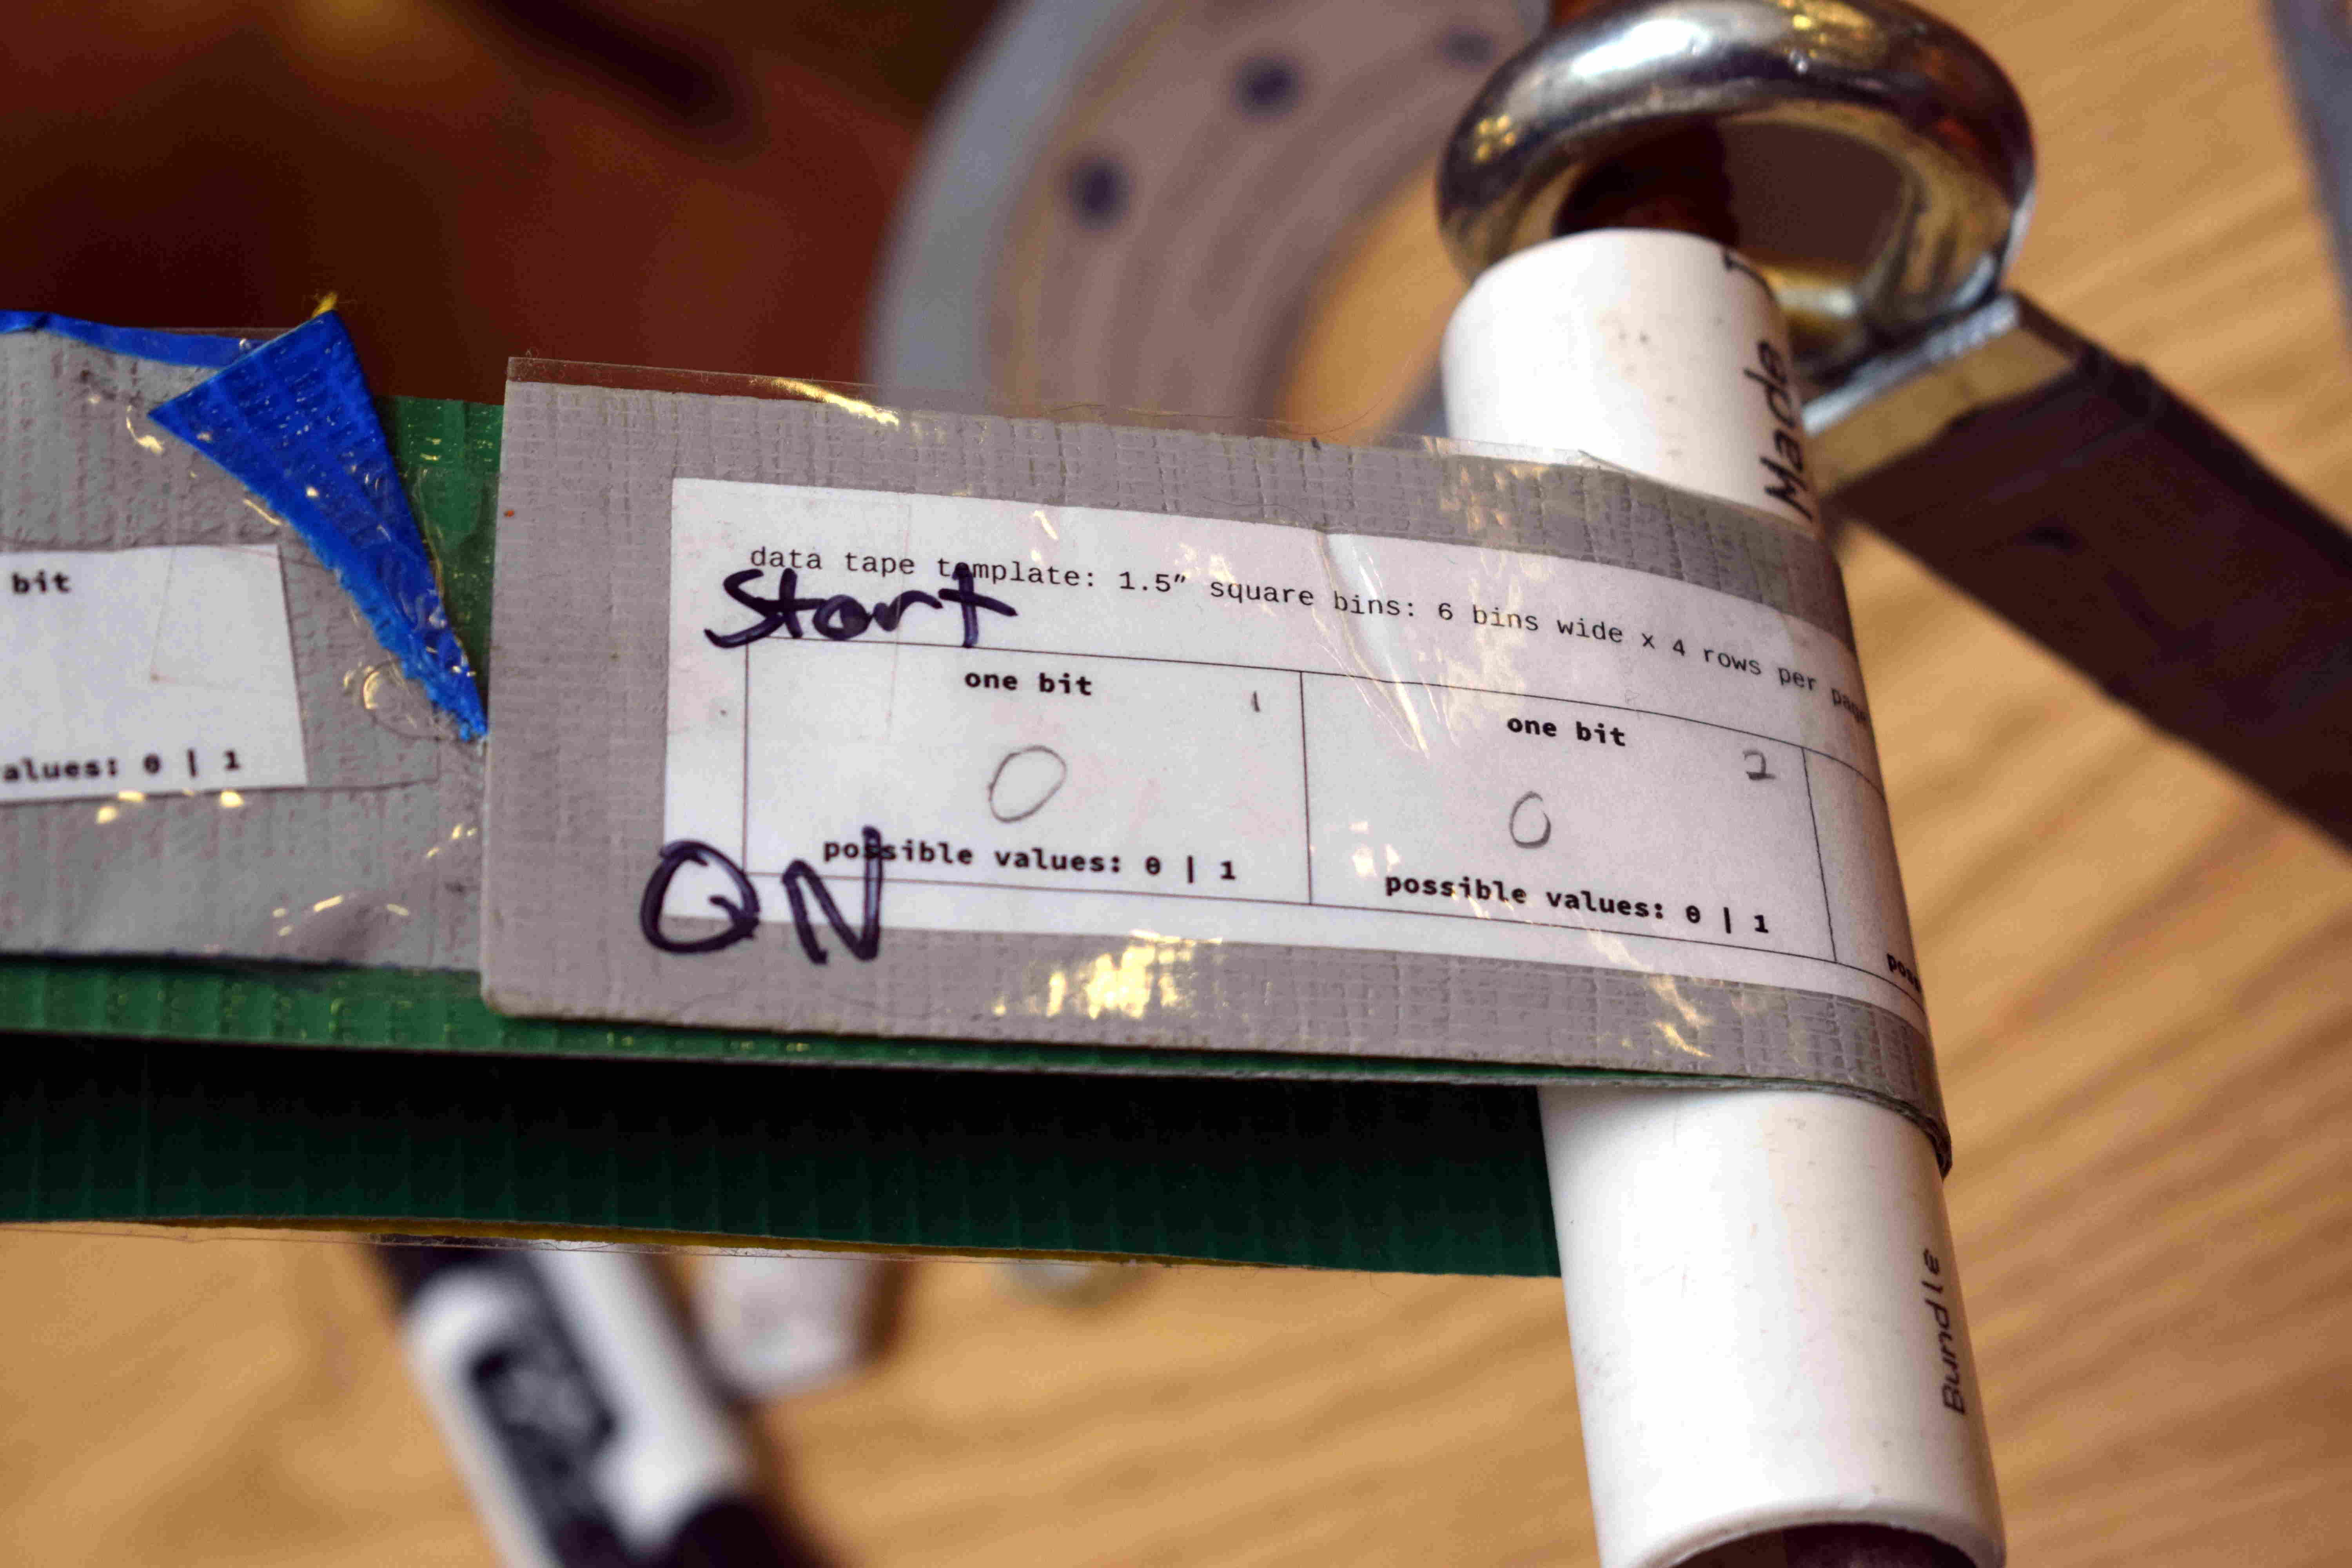
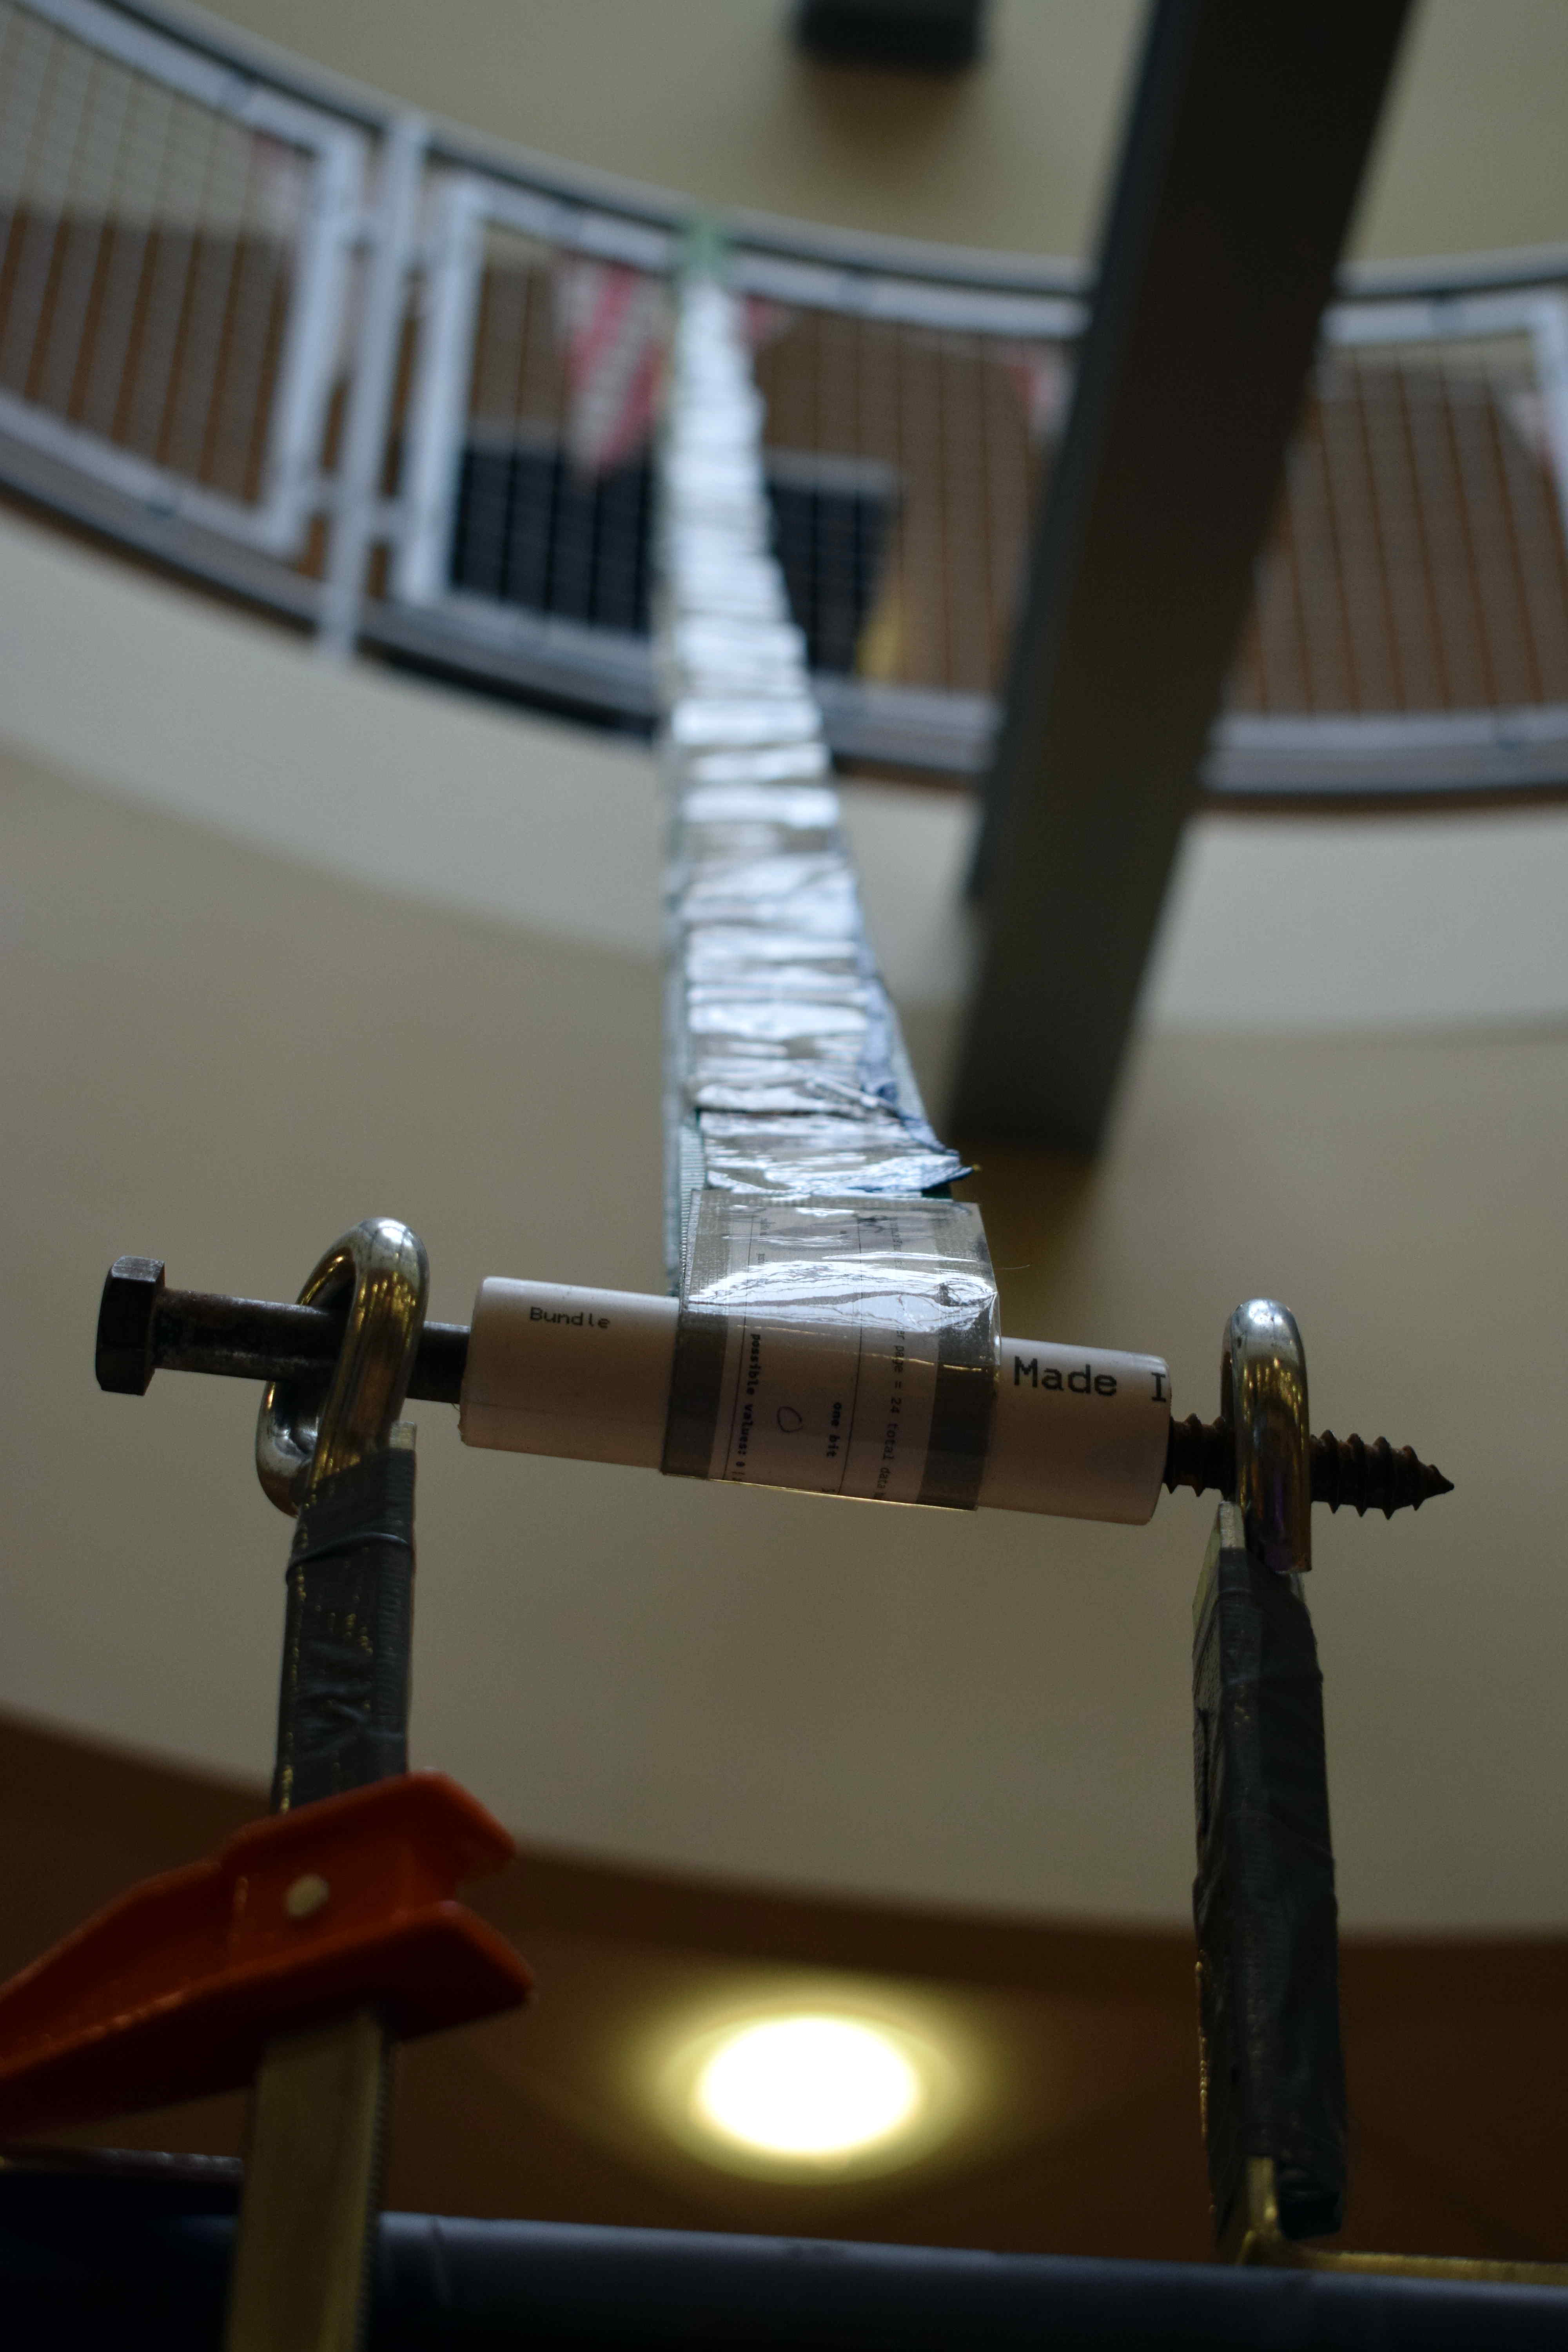
Decoding by custom software
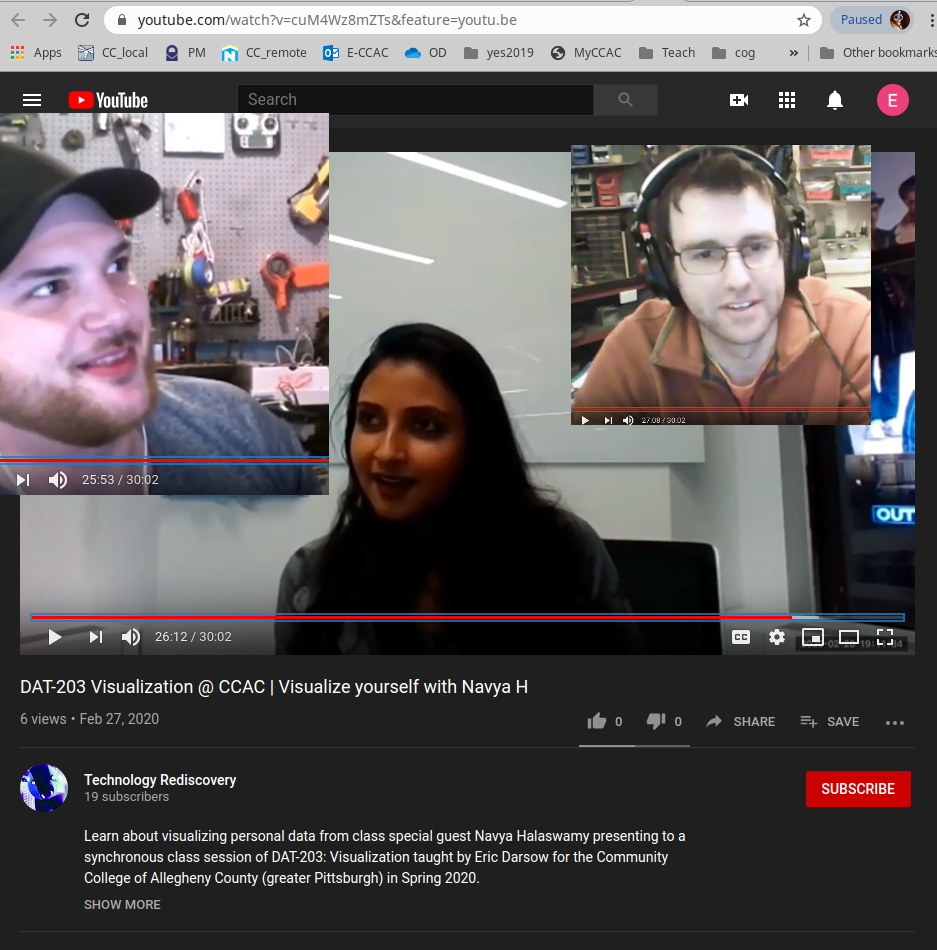
7.d.Pilot of synchronous online class sessions for DAT-203
A quick-and-easy polling of students at the end of the last session revealed an average desire to continue the online format of 9.33, well above my expected rating.
Synchronous session guest
7.e.Collaborative creation of experimental course ATE-252
In collaboration with faculty in Mechatronics, Data Analytics, and Automotive Technology, I have spearheaded the creation of an experimental course that focuses on transferrable skills in electronic sensor data processing and response.
Guest Speaker Mark Egge
Data Analytics program advisory committee member Mark Egge of High Street Consulting met with ATE-252 students in Spring 2020 to unfold the mysteries of transportation data on the state level.
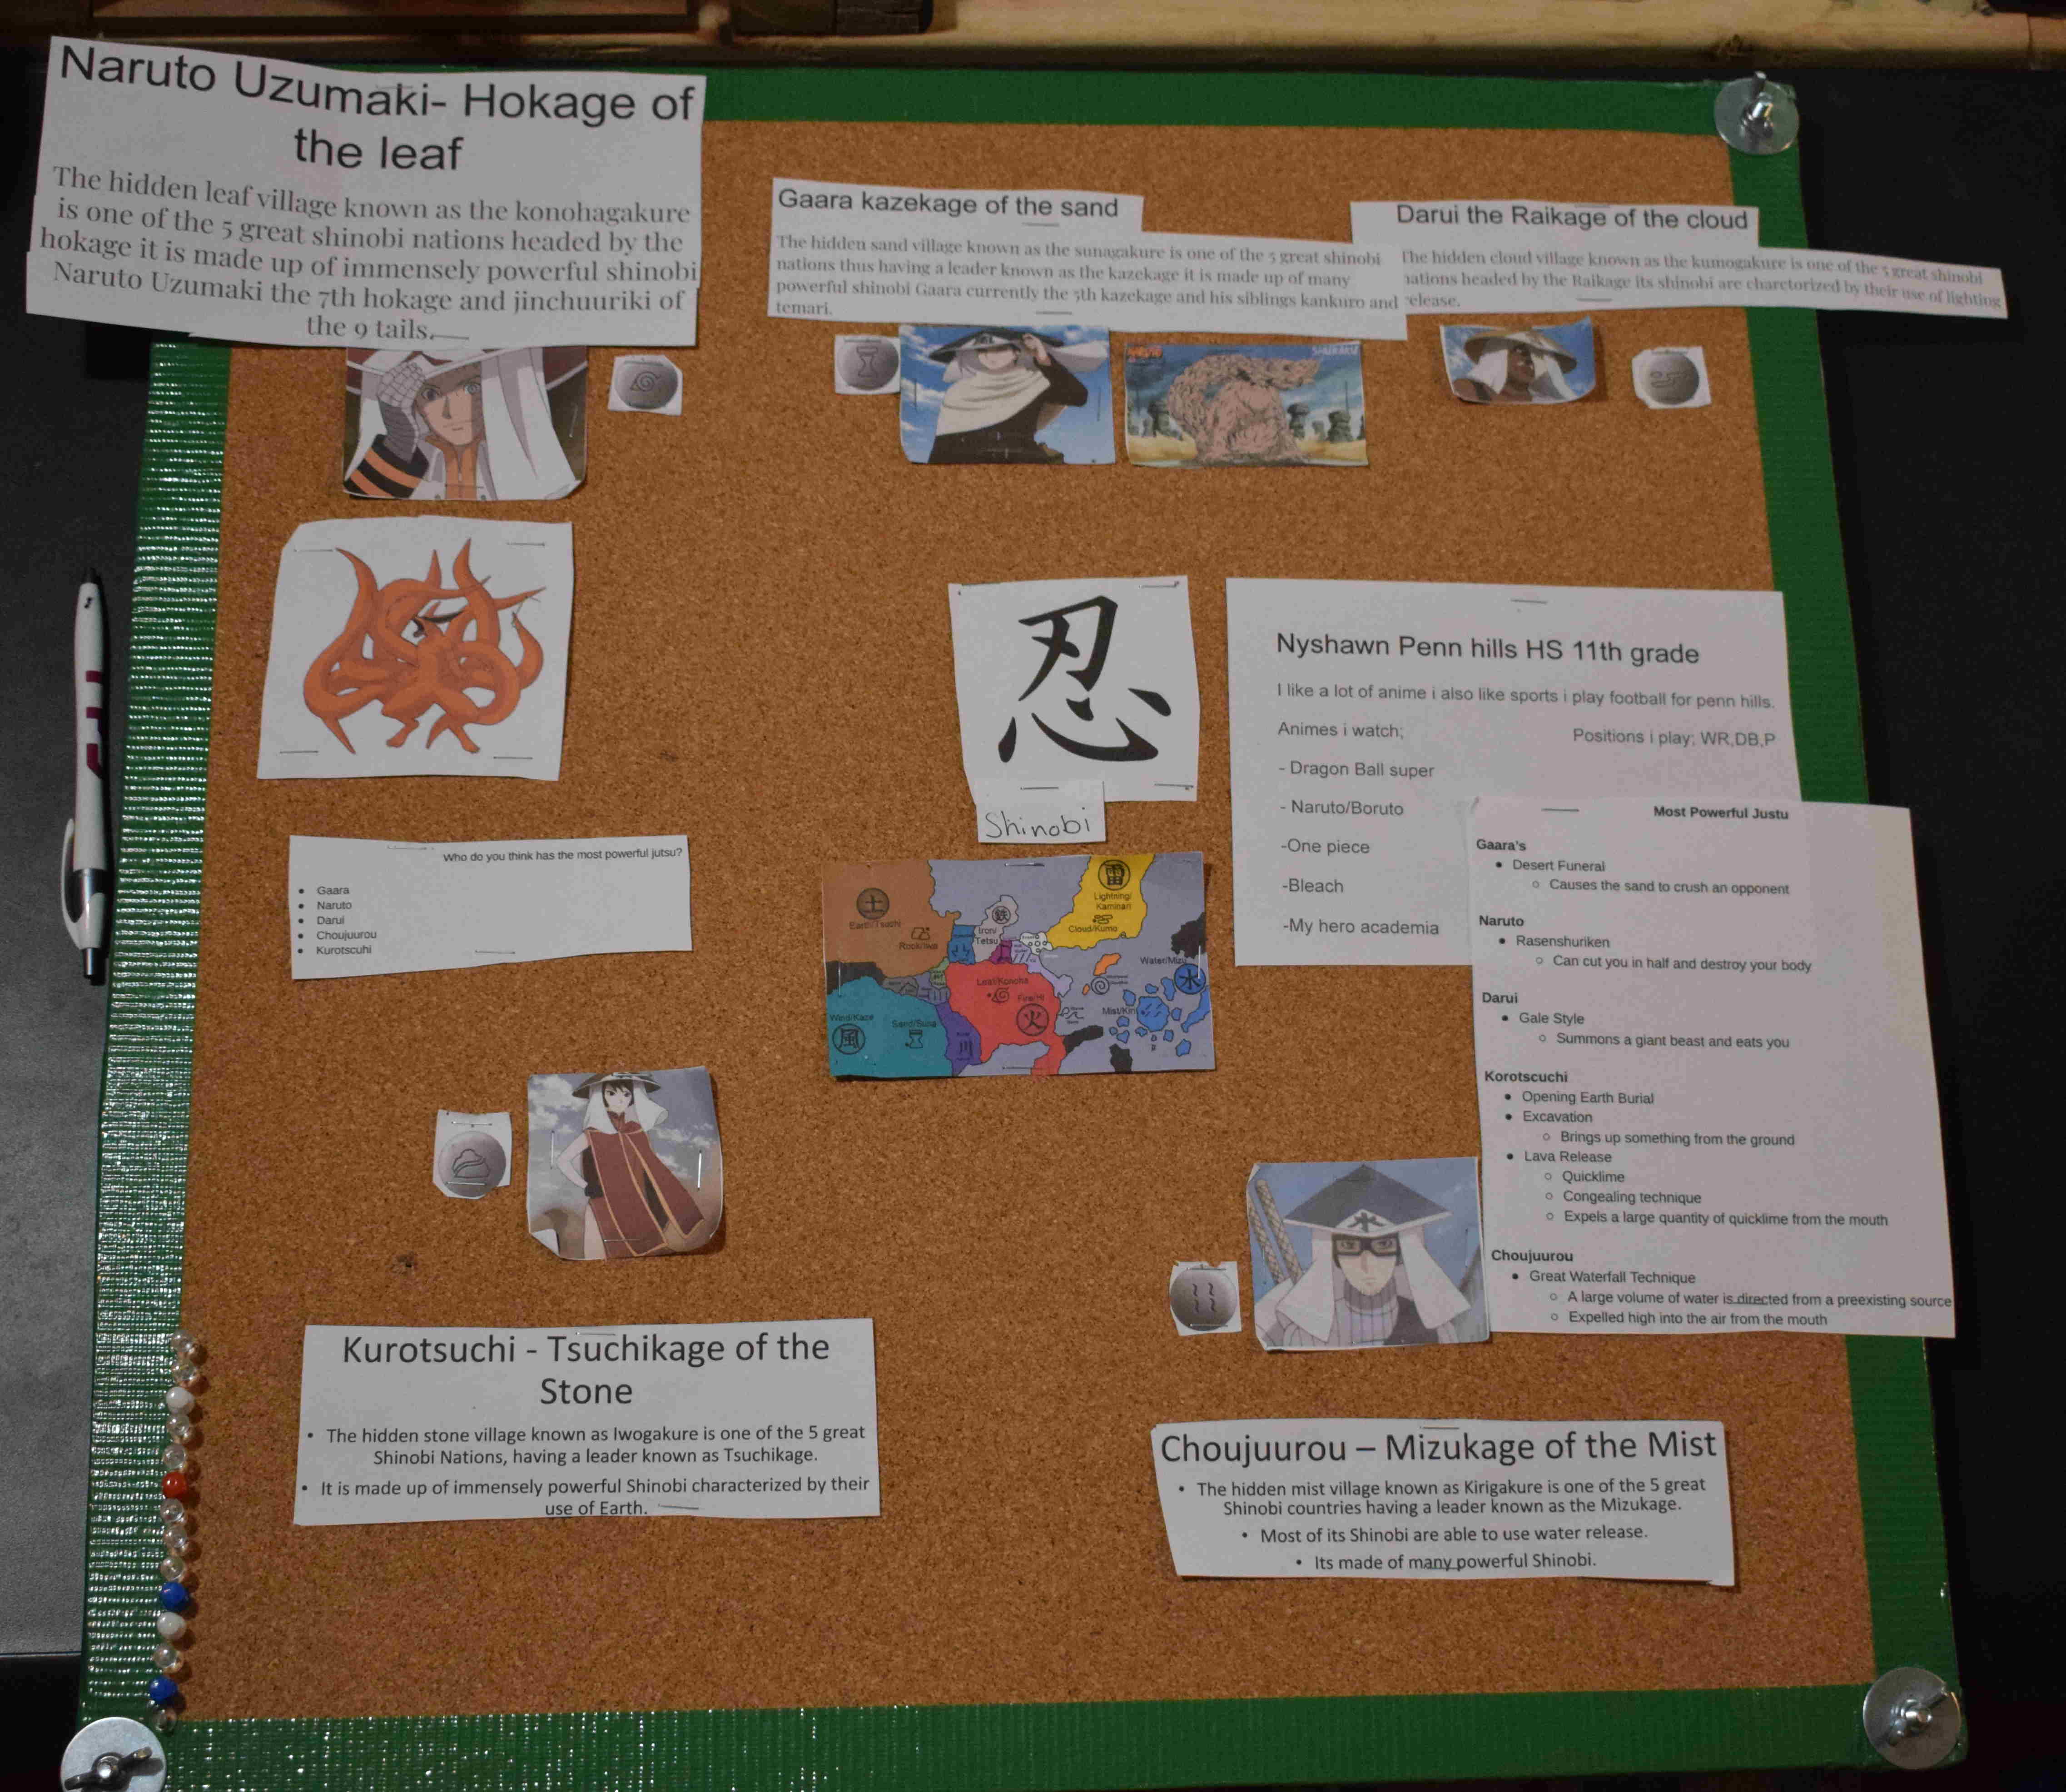
7.g.Manufacture of durable, low-commitment student display boards from recycled building materials
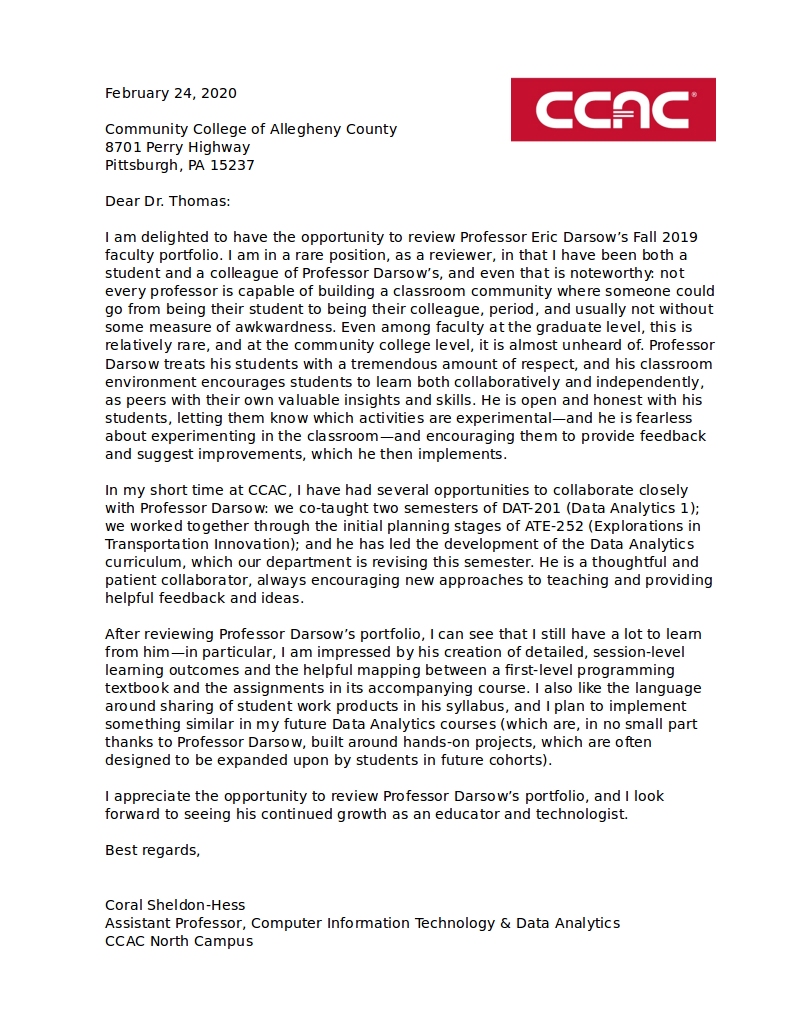
8: Written assessment from reviewers
9: Information or Involvement in Assessment
9.a.CCAC integrated assessment
As required by the college, I submitted rubric scores for my students in DAT-102: Introduction to Data Analytics. I have created the skeleton of a write-up regarding my process of doing so which focuses on developing a rubric specific to the instrument I used for the assessment which required students to evaluate a peer's data project and compute a confidence interval around a point estimate from that project.
A key challenge in assessing the skills in the application strata of difficulty is providing students both novel and sufficiently "messy" data such that they are required to meaningfully adapt their knowledge to the provided context. By asking students to compute a statistic using a peer's project data, students are engaging with data that has inherent meaning--by virtue of it having been produced by a fellow student and not extracted from a book or the professor's trove of tests. This increases the innate incentive to correctly compute the result.
Additionally, as a teacher, scoring student work based on other student work required active evaluation of both the responding student as well as the creator of the project of interest to that responding student. If the project creator incorrectly computed a point-estimate, the responding student is challenged to discover and document the error--a high level thinking skill.
9.b.Teaching self-assessment
As the author of most of my own course content, I am actively managing hundreds of HTML documents, thousands of images and figures spread across seven or more courses. Developing a course involves iteratively improving content as the course is taught and re-taught by devoting attention to the specific ways in which existing tools are inaccessible or confusing to students.
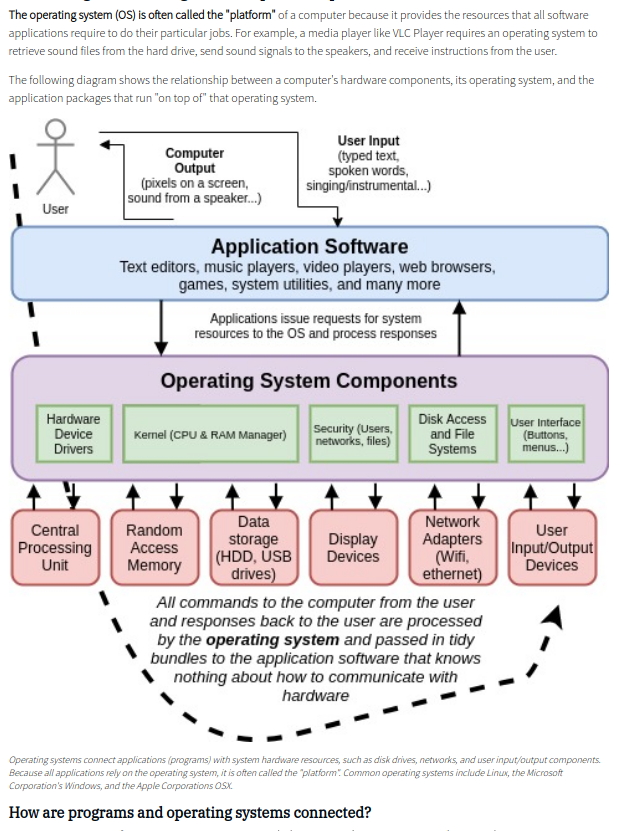
One example of a small-scale iterative development which typifies the incremental nature of my course building is my experience teaching with, reflecting on, and revising a technical diagram related to computer operating systems.
The following screen clip shows the original operating system diagram I created during the Spring of 2019--almost a year ago--which confusingly connects a graphic depicting a generic user with a component of hardware.
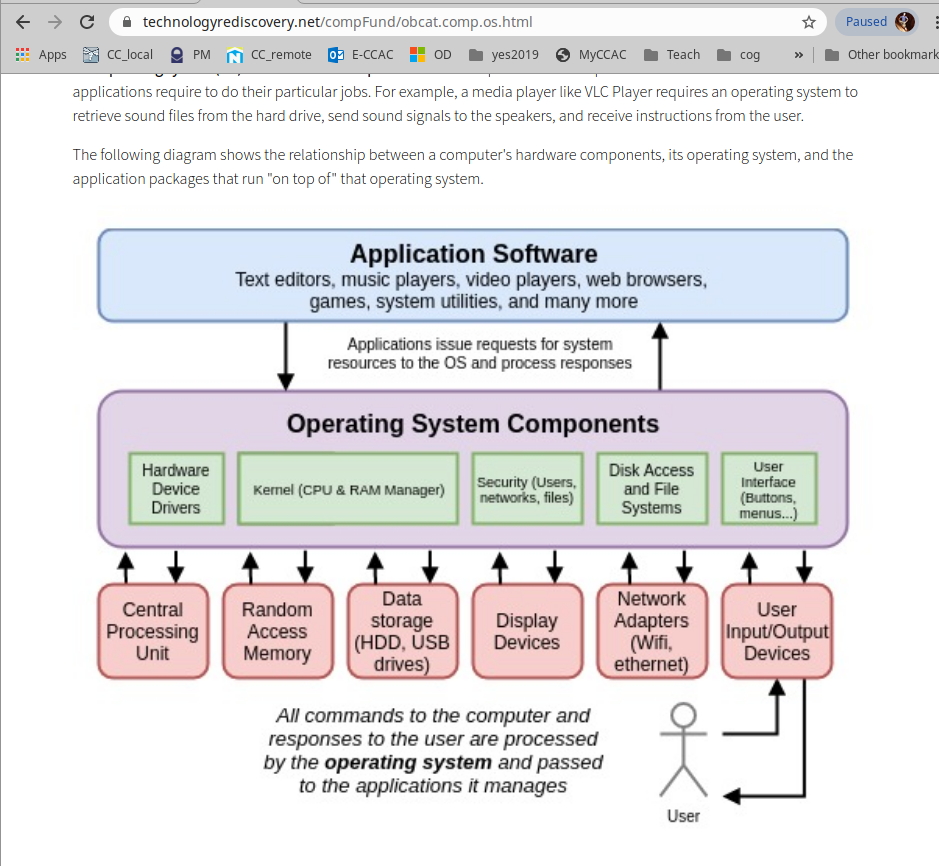
Upon reflection during the teaching process, I realized that the conventional way to think about a generic user's interaction with the operating system is by engaging with application software which, when hardware interaction is needed, makes requests through the operating system--not with the hardware directly.
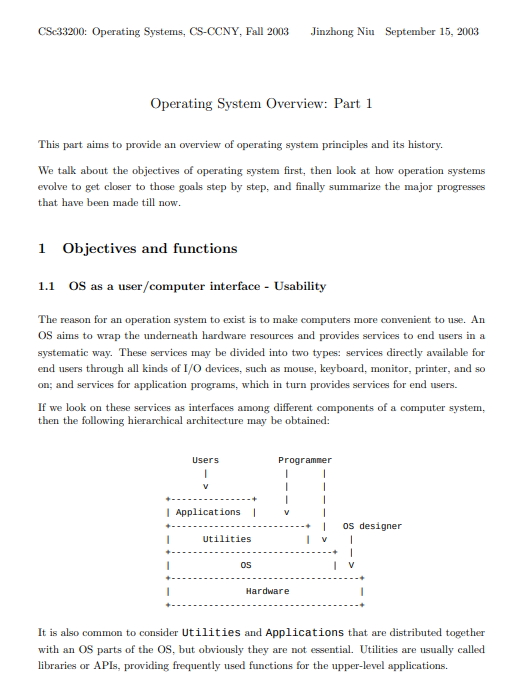
Consulting expert sources
In assembling learning materials for the OS module, I linked to a set of lecture notes by Professor Niu at CCNY whose diagram places users as interacting with the application layer:
Revised diagram
I had the raw draw.io file available in my google drive, so I updated the relationship and adjusted the caption and posted the changes to the OS module page:
10: Information related to enhancing equity and diversity
10.a.Embedding race and gender inequity discussion course content
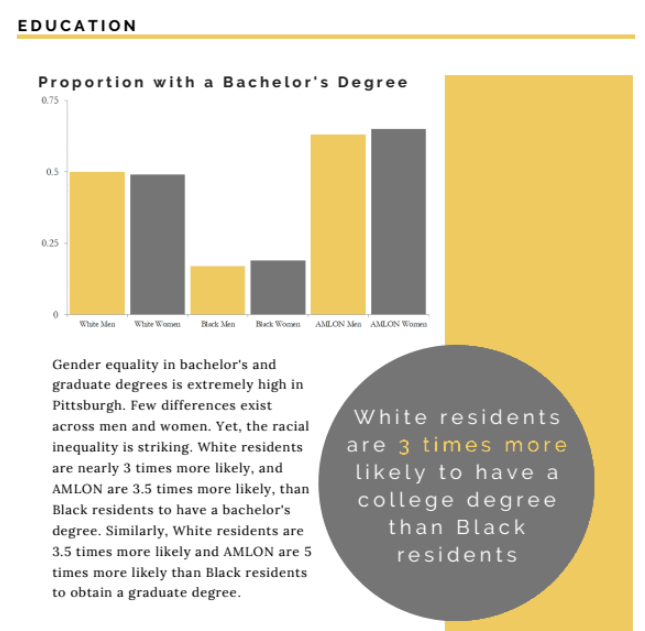
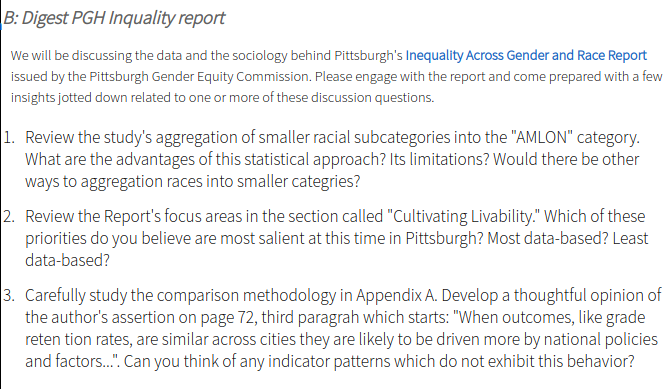
I invited my DAT-102 students to study the Pittsburgh Gender Equity Commission's Report released in 2019 detailing social and economic measures which reveal deep divides in Pittsburgh across gender and race. The full report is here, and below are screen shots of the report itself and the questions we discussed as a class.
Integration into DAT-102
10.b.Community-oriented, field-rich data summer camp 2019 with Youth Enrichment Services 501(c)(3) and Technology Rediscovery LLC
Summer 2019: Partnering with Youth Enrichment Services (YES) based in East Liberty, Pittsburgh, I worked with six high school/college-bound students who investigated the data-related dimensions of a topic of their choosing.
The students participating in YES's programs often experience one or more dimensions of marginal status in context our society's hierarchical social strata. Nearly all of the students participating in the 2019 summer cohort hailed from high schools whose science programs are classified by YES as severely under-resourced.
11: Service to the college and/or community
11.a.Middle schoolers visit CCAC North
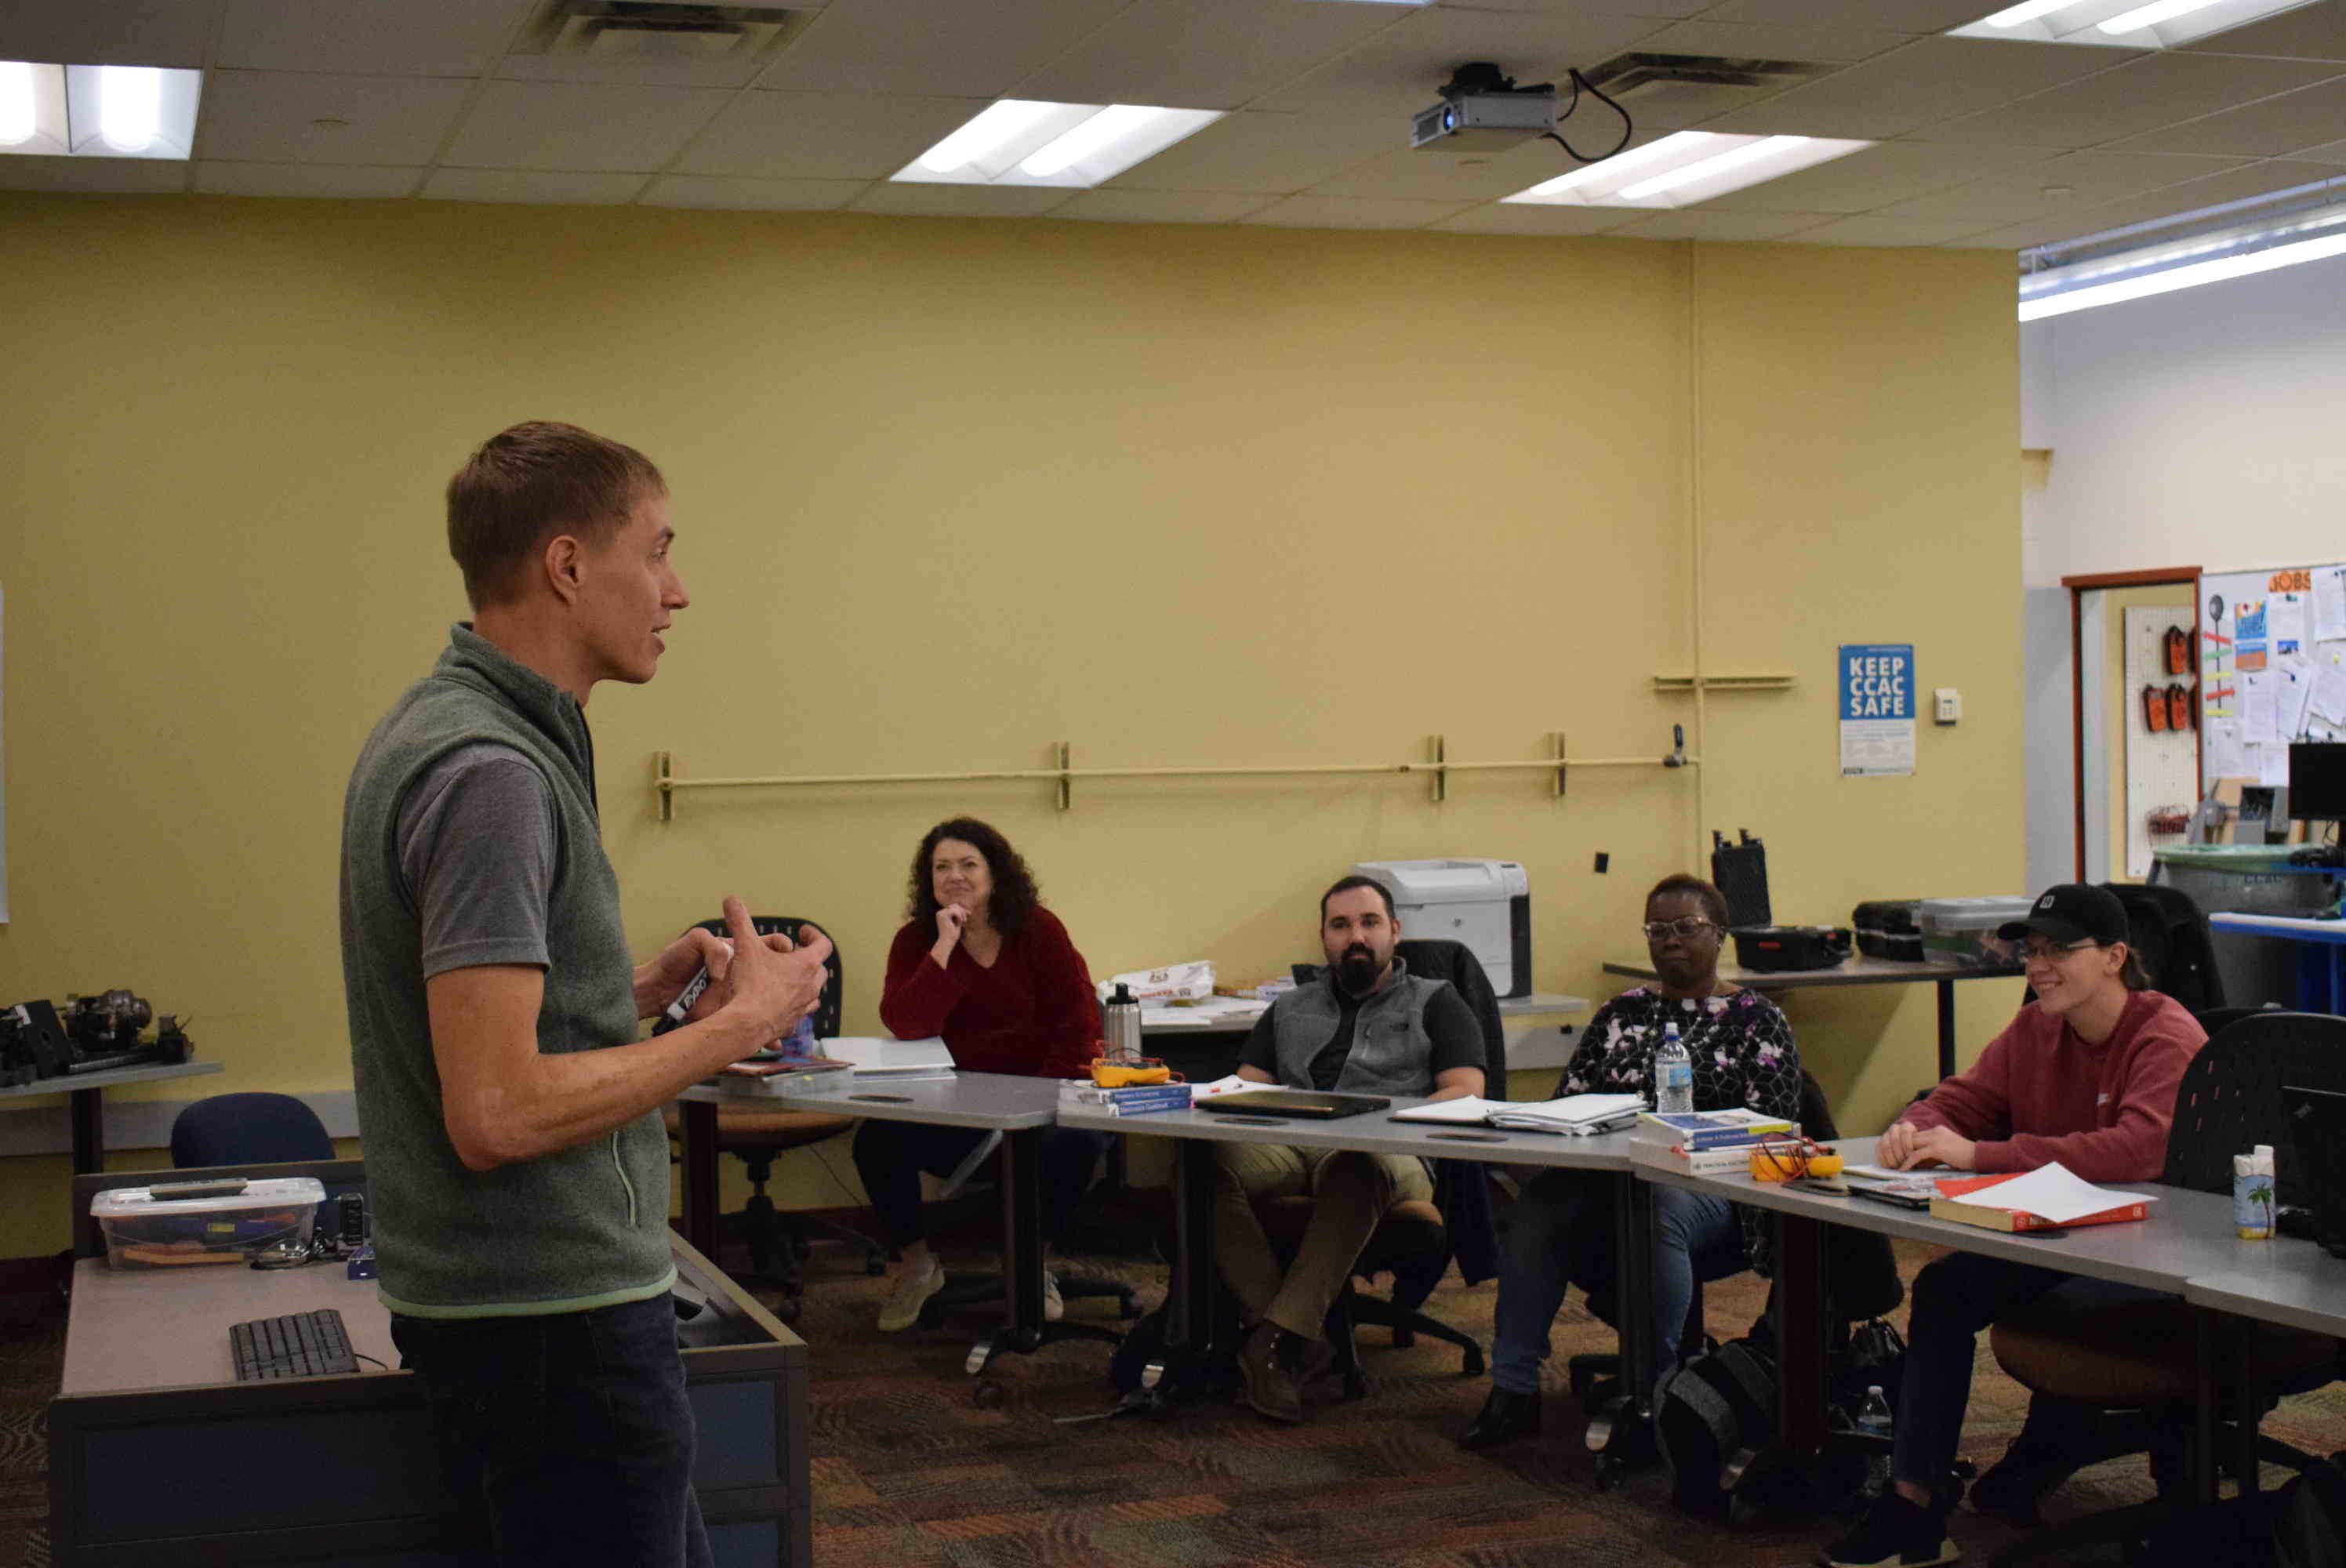
During Fall 2019 on November 15th, I collaborated with my teaching assistant to prepare an activity suitable for groups of 60 middle school students from West Allegheny school district who visited North campus. While an event I would never repeat--even under duress--due to the young age of the students and the sheer madness of a room filled with sixty 13-year-olds, we were able to keep them engaged for the alloted time by teaching the fundamentals of computer communication: binary!
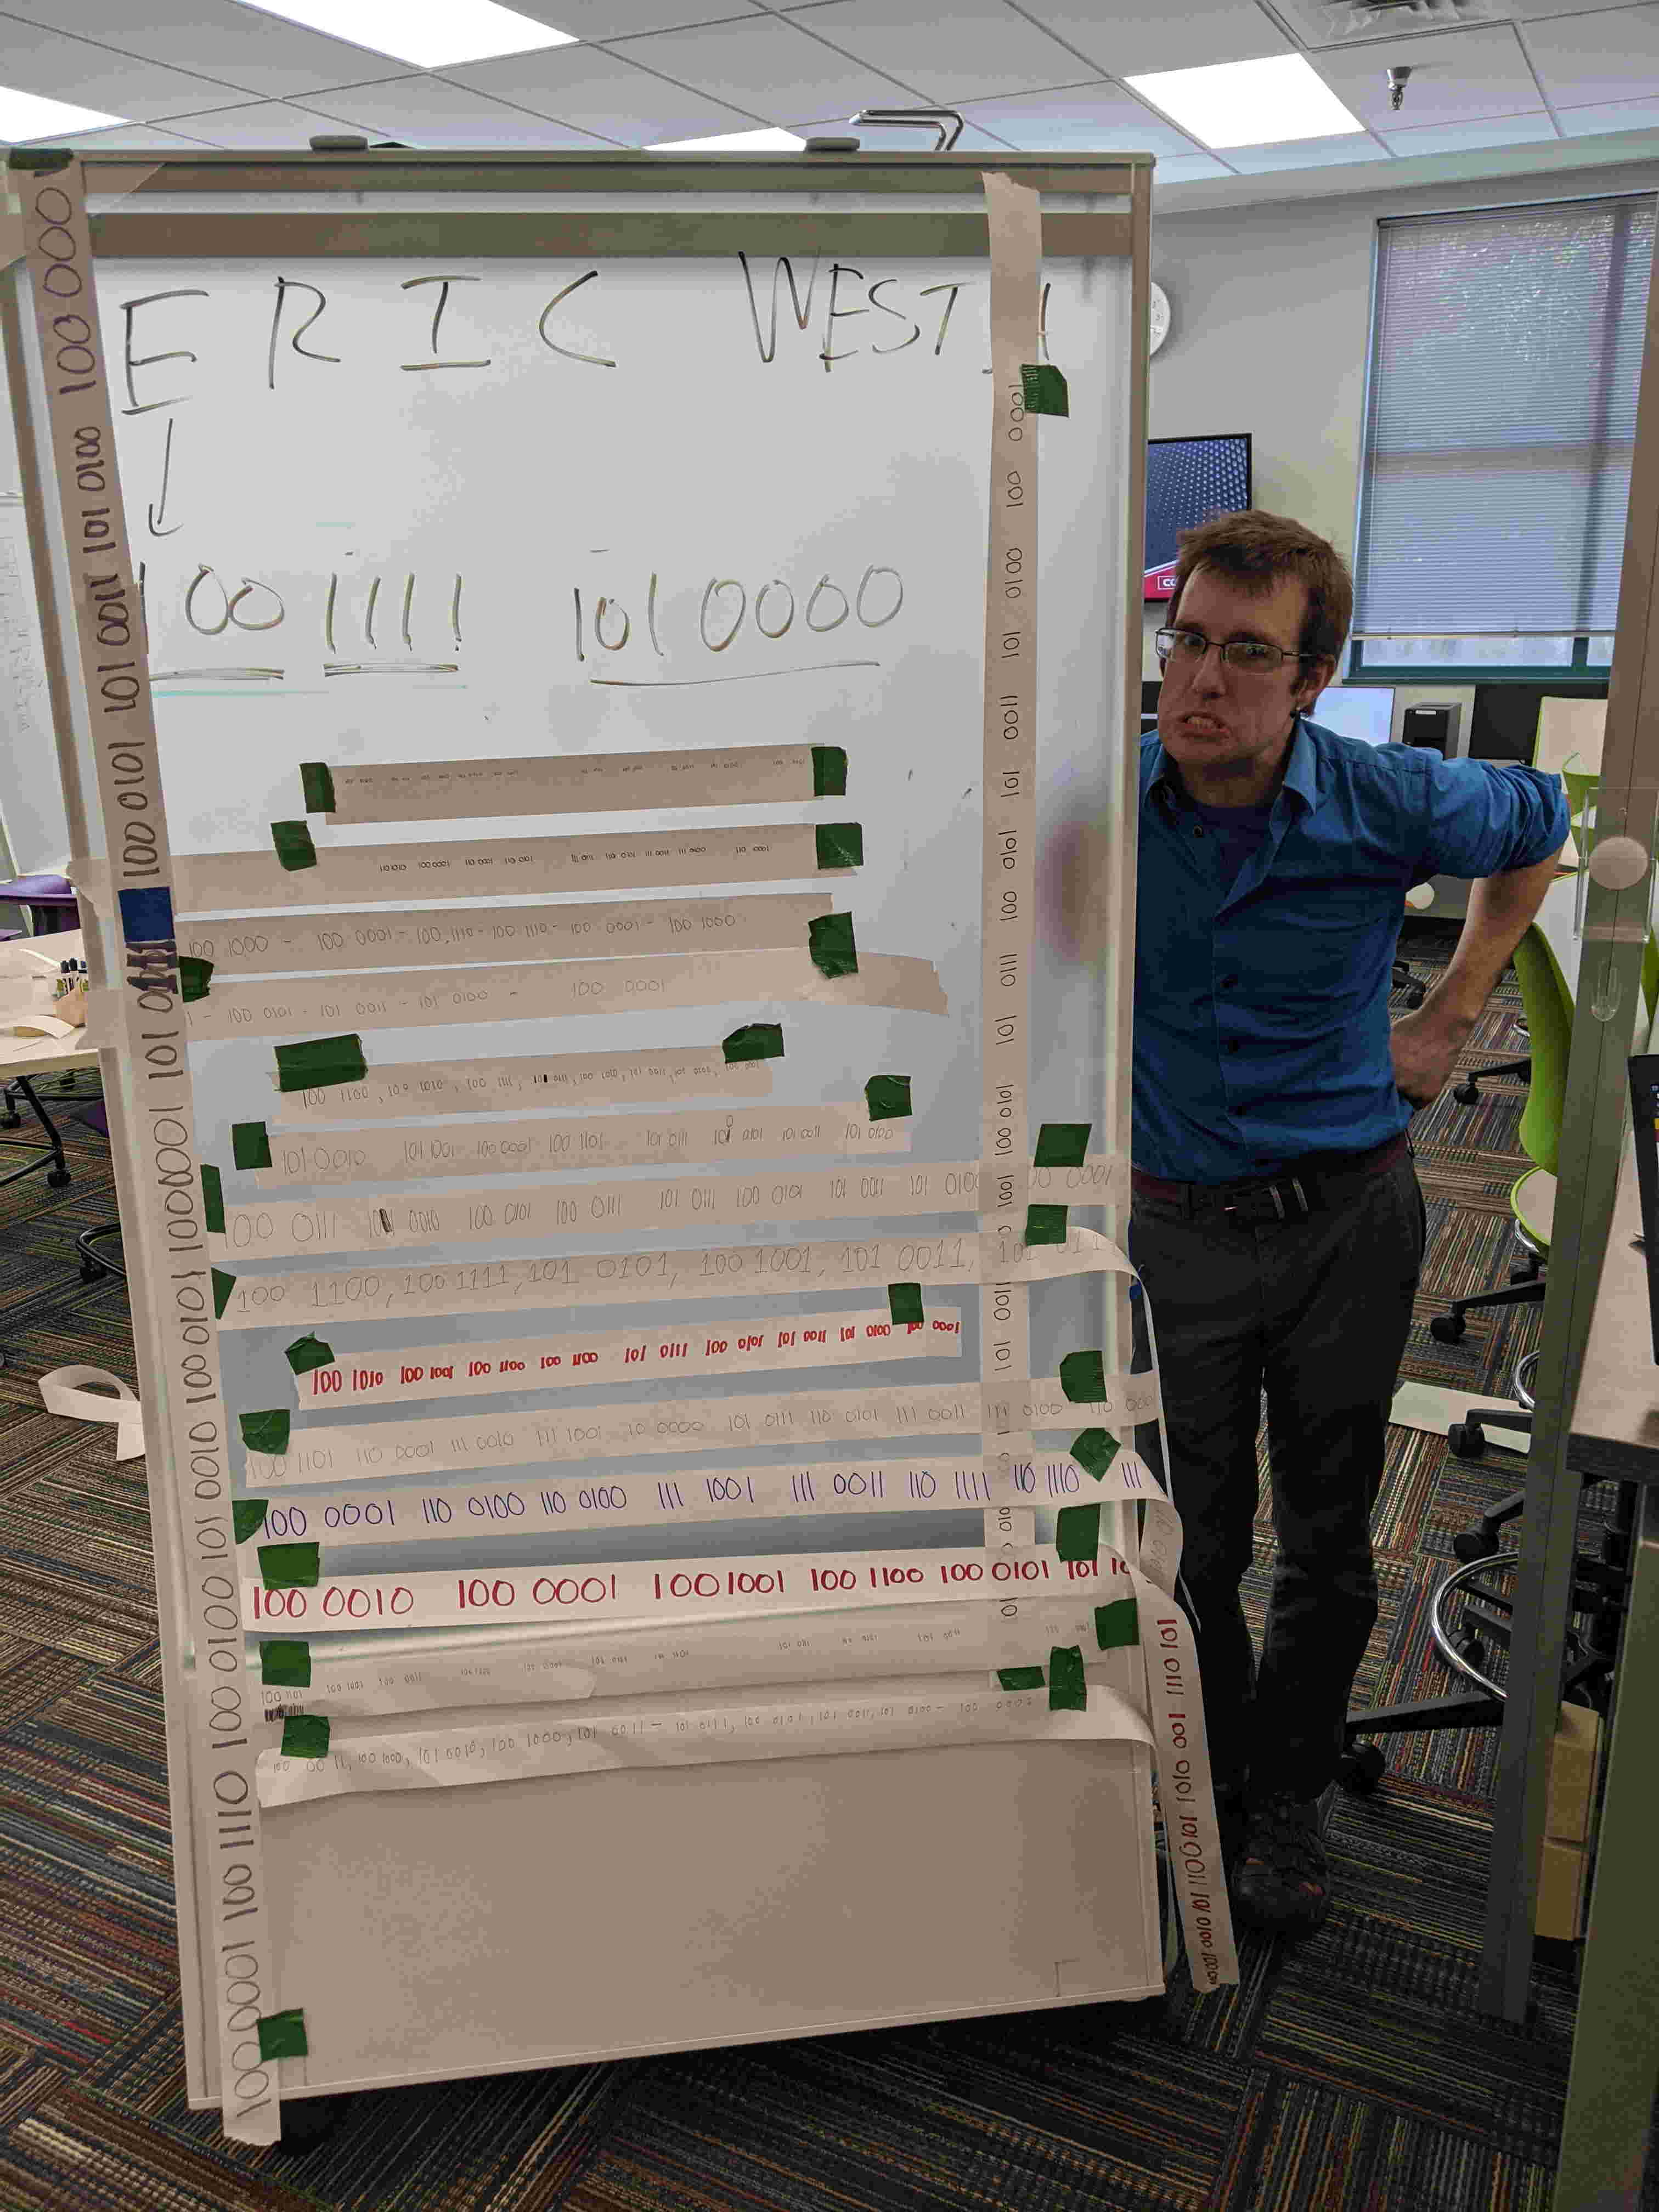
The above image is a capture of exhausted me, and the adding machine tape containing the secret messages created by middle school students converted into binary (base 2) and taped to the rolling plastic sheets in the Innovation Lab.
11.b.CCAC North campus scavenger hunt activity development
Several years ago I began working with our admissions and outreach team at North/West to develop an activity for visiting high school students to undertake which fosters exposure to various spaces and components of college life.
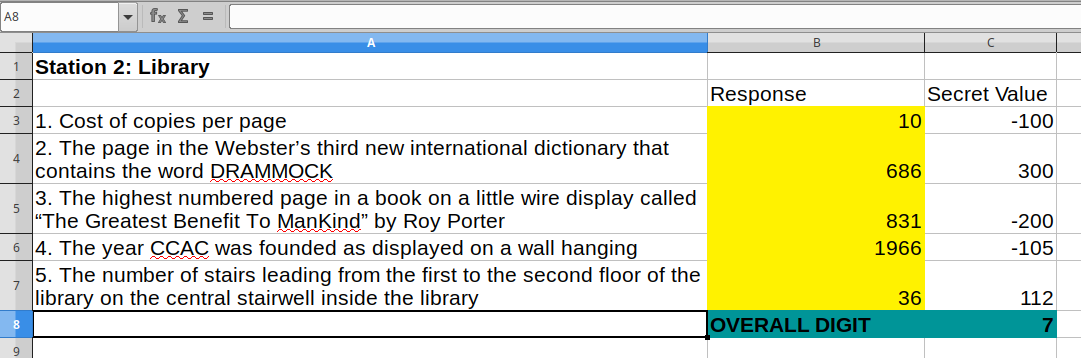
As a former high school teacher myself, I've iterated over the design of the activity over the course of a half dozen or so sessions with high schoolers, finally arriving at what I believe is a robust, team-oriented activity which both exposes students to spreadsheet fundamentals in a non-threatening way and encourages them to explore the North campus facility. The beta tested tool is an open document spreadsheet:
As the screen shots below depict, the visiting students are divided into teams and provided a laptop (supplied by a local software development company Technology Rediscovery LLC) containing a spreadsheet whose tabs correspond to a place on campus to visit. Students are given a set of clues that require them to engage with each particular space in a way that produces a number. When that number is entered into the appropriate cell in the spreadsheet, the VLOOKUP function extracts a secret value mapped to the students' answer. When the column of secret values is added, an overall value is computed, which becomes part of a combination to a lock protecting a sugary treasure. If students are careful, their work results in a correct lock combination!

12: Statement of anticipated future professional growth
Expanding the low-tech classroom
Computers may be the subject of our study in many CIT-classes, but meaningful learning about something so small and complex demands learning metaphors relevant to brains optimized for scales many orders of magnitude grater than the level of the modern silicone wafer.
"The Low-tech Classroom" titles the range of teaching aids I've designed for computer essentials, java programming, and data analytics which involve creation and manipulation of tangible materials representing abstract concepts.
Various additions to the collection are planned for the 2020-2021 school year:
- Completion of the modular Java class building plates: These cardboard plates are backings to outlines of Java classes with replaceable inner components, such as member variables and methods. I have prototypes created, but they need exercises to accompany them
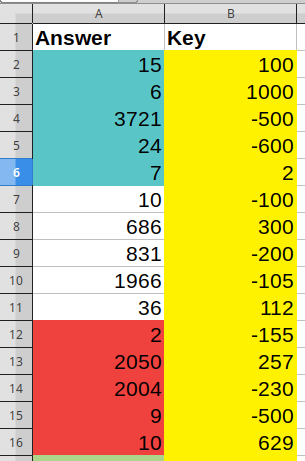
- Ruler-Clip box plots: I've acquired about 25 meter sticks and several hundred colored utility spring clamps which can be affixed temporarily along the ruler while sitting horizontally to represent various statistics related to a single data set. Initial trials suggest that mounting them horizontally in a vertical stack of a dozen or more rulers is tricky. It's easy to mount them sloppily, but creating fixed distance segments of string needs a better system.
Developing peer feedback system
The central feedback I've faced developing a almost a dozen courses from scratch to fully embrace the project-oriented spirit has involved setting aside less time to feedback to students on their--often very high quality--work. Prioritizing in-class instruction quality has, I believed, proved exponentially more valuable in the long-run as far as the marginal minute of work is concerned.
Yet providing individualized feedback on student work that is suggestion heavy and thoughtful remains a core function of a teacher-student dynamic. My plan for improving in this area centers around sharing the individualized feedback I give to students with the entire class such that the time dedicated to generating the feedback can benefit more than a single student.
Creating feedback of high enough quality worth sharing is a demanding mental task with high time requirements. I hope that with the graduation of our first cohort of Data Analytics students and the teaching of all our core courses, I'll feel as if more time can be dedicated in the future for writing and publishing student feedback.
The principles guiding my student feedback are as follows:
- Choose a handful of students whose work levels are representative of the entire spectrum of fully-baked work products submitted
- Only give written feedback on full-baked work that was the result of significant student effort. Work with students in-person and by pairing students together to support the completion of fully-baked work products.
- Publish feedback to students alongside the actual work receiving that feedback such that students can immediately and easily review both the work and the feedback.
- Center feedback on concrete next steps for improving their work, even work that's done at a high level.
- Include links to resources useful for learning about the next steps required
Optional 1: Sample of Handouts
My handout creation process has varied over the years. This past Fall I endeavored to create a web template that could both function as a printable handout for students and a full page of web content for display during class.
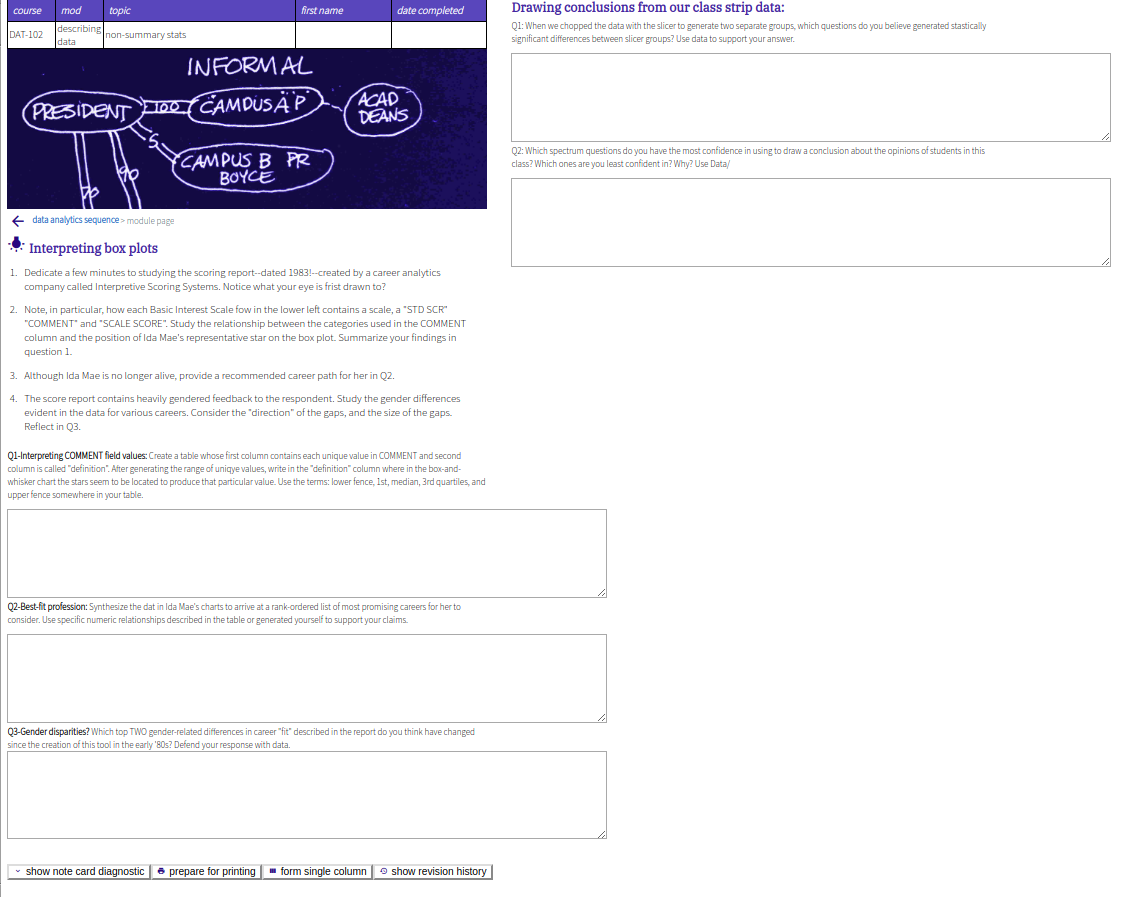
The following link is to an implemented template for box plot interpretation. Note the buttons on the bottom of the first column allow the user to collapse the page for printing and to shift to one column for we display.
The two column layout
The controls and note-card diagnostic
Optional 2: Samples of Unsolicited Students Letters and Comments
I recently received this email from a student about a past term CIT-115 class:
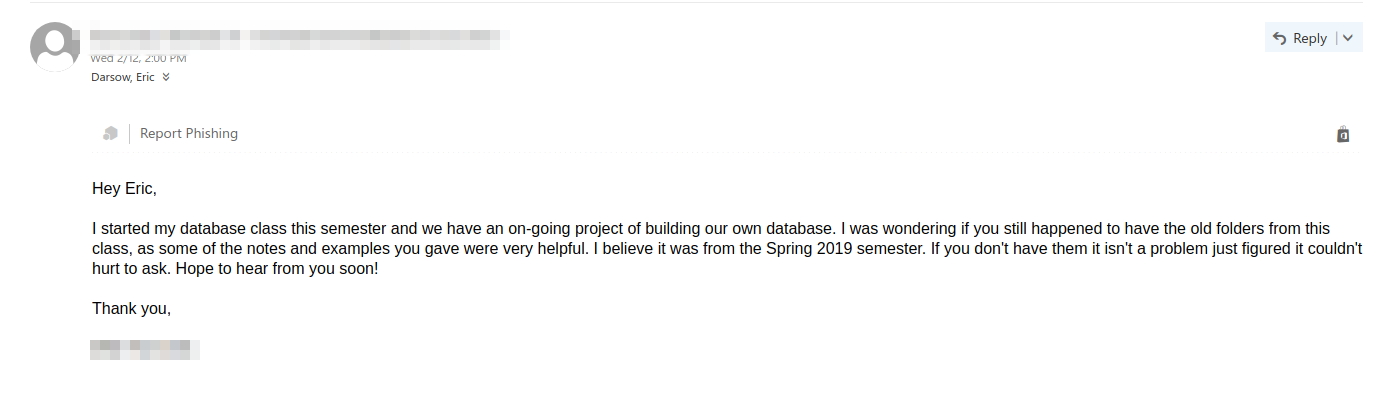
I was gratified that my database modules were remembered as useful enough to warrant hunting down terms later. The clip board database concept falls under the low-tech classroom array of tools which make tiny, fast digital device components slow and handle-able.
Page created in 2020 by Eric Xander Darsow and all non-linked content can be freely reproduced without any permission or attribution according to the site's content use agreement. Any links to other content is governed by each page's respective usage rights context.