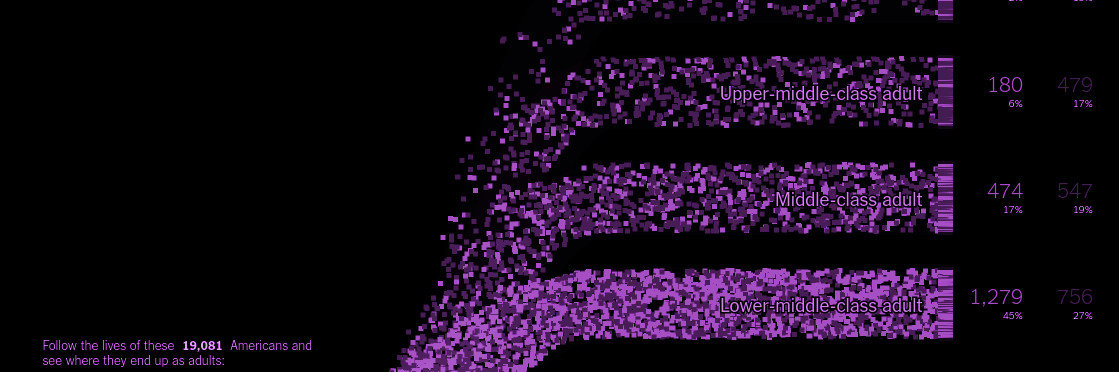
stylized extract from a New York Times visualization of social mobility data drawn from The Opportunity Atlas
techred home > python 2 sequence > analytics
Analytics with python
[sqlite3, numpy, pandas, matplotlib]
bookTextbook sections
Dietel provides step-by-step examples with numpy and some pandas in chapter 7: Array-Oriented programming with NumPy
bookCore documentation
database: sqlite3

plotting: matplotlib
manipulation: pandas
Video tutorial resources
Misc resources
crunching base: numpy
bookSample code
bookData sets for exercises
listLesson Sequence
- Library building blocks: numpy and pandas
- Hello world
- Exploring health code violations with pandas
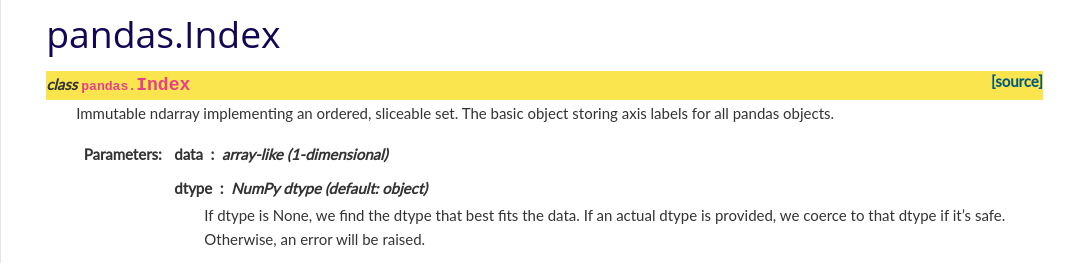
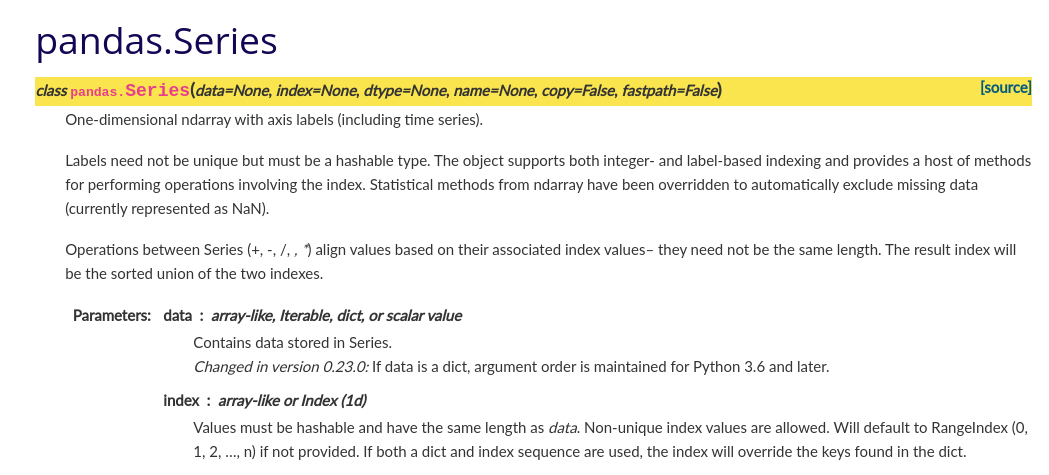
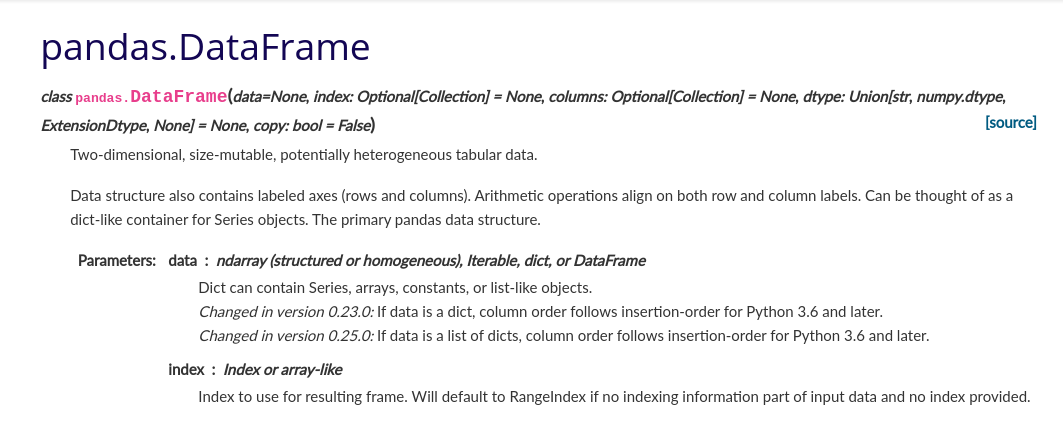
emoji_objectsCore objects: Index, Series, and DataFrame
The screen clippings of the API documentation below link to the object-specific overview subpages within.
cakeWork specification
- Code to the specification below. Then upload your a python files and any related documents to your GitHub account oragnized in sensible ways with informative commit messages
program objective |
Write a script that answers basic data-based questions concerning health violations in Allgheny county |
questions to pursue in Allegheny county health code violations |
|
choose your own dataset |
Choose a dataset of your own or one listed on the Western PA Regional Data Center. It will be easiest to choose a dataset published as CSV file type for ingestion by pandas. Write a script that uses pandas to describe the value counts of each key variable. Then slice your dataset using a value in a column of your choosing and compare a pattern of your choosing between your sliced sub-data-sets. |