
DAT-102: Final Projects Fall 2018 (with commentary)
Browse our gallery of selected final projects created and shared during Fall 2018. To facilitate skill growth, instructor commentary is bundled with most projects. Student names have been redacted. Note that not all Fall 2018 projects are excerpted here due to extreme quality variation, pedagogical value, and time constraints. If your work is linked here and you'd like it taken down, please place a request to Eric at 412.894.3020.
Jump to a project
view_listProject specifications
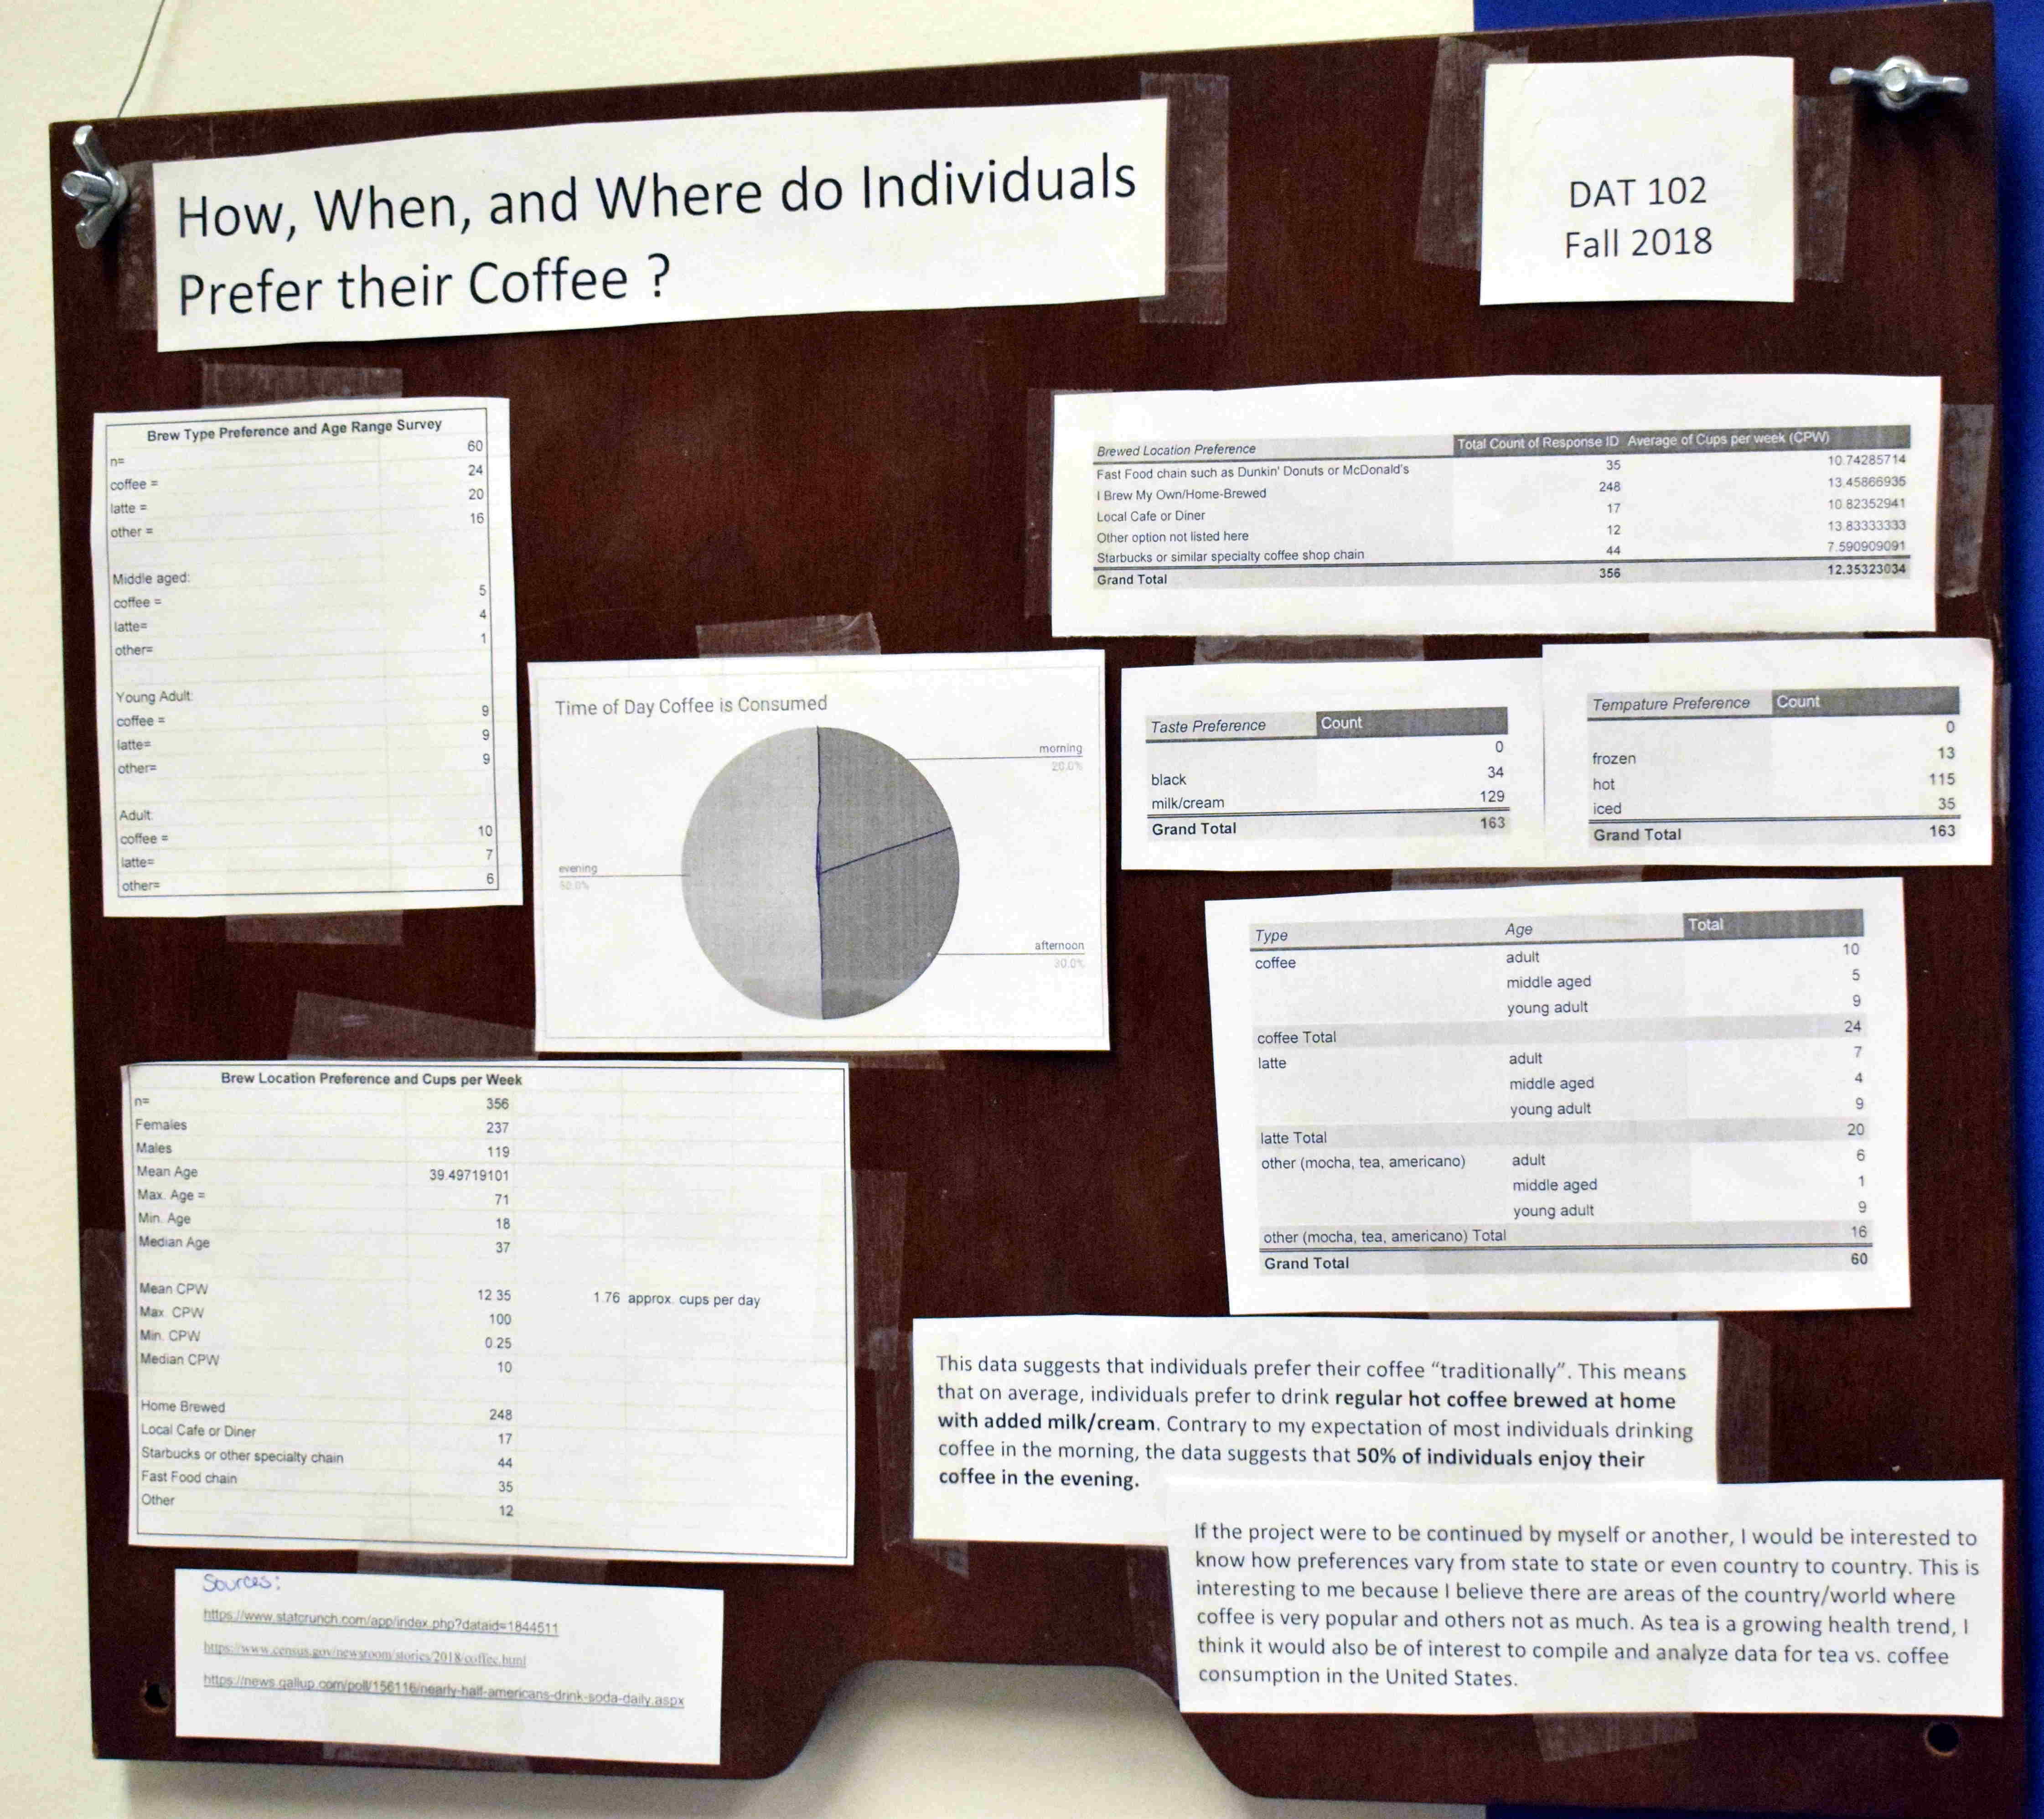
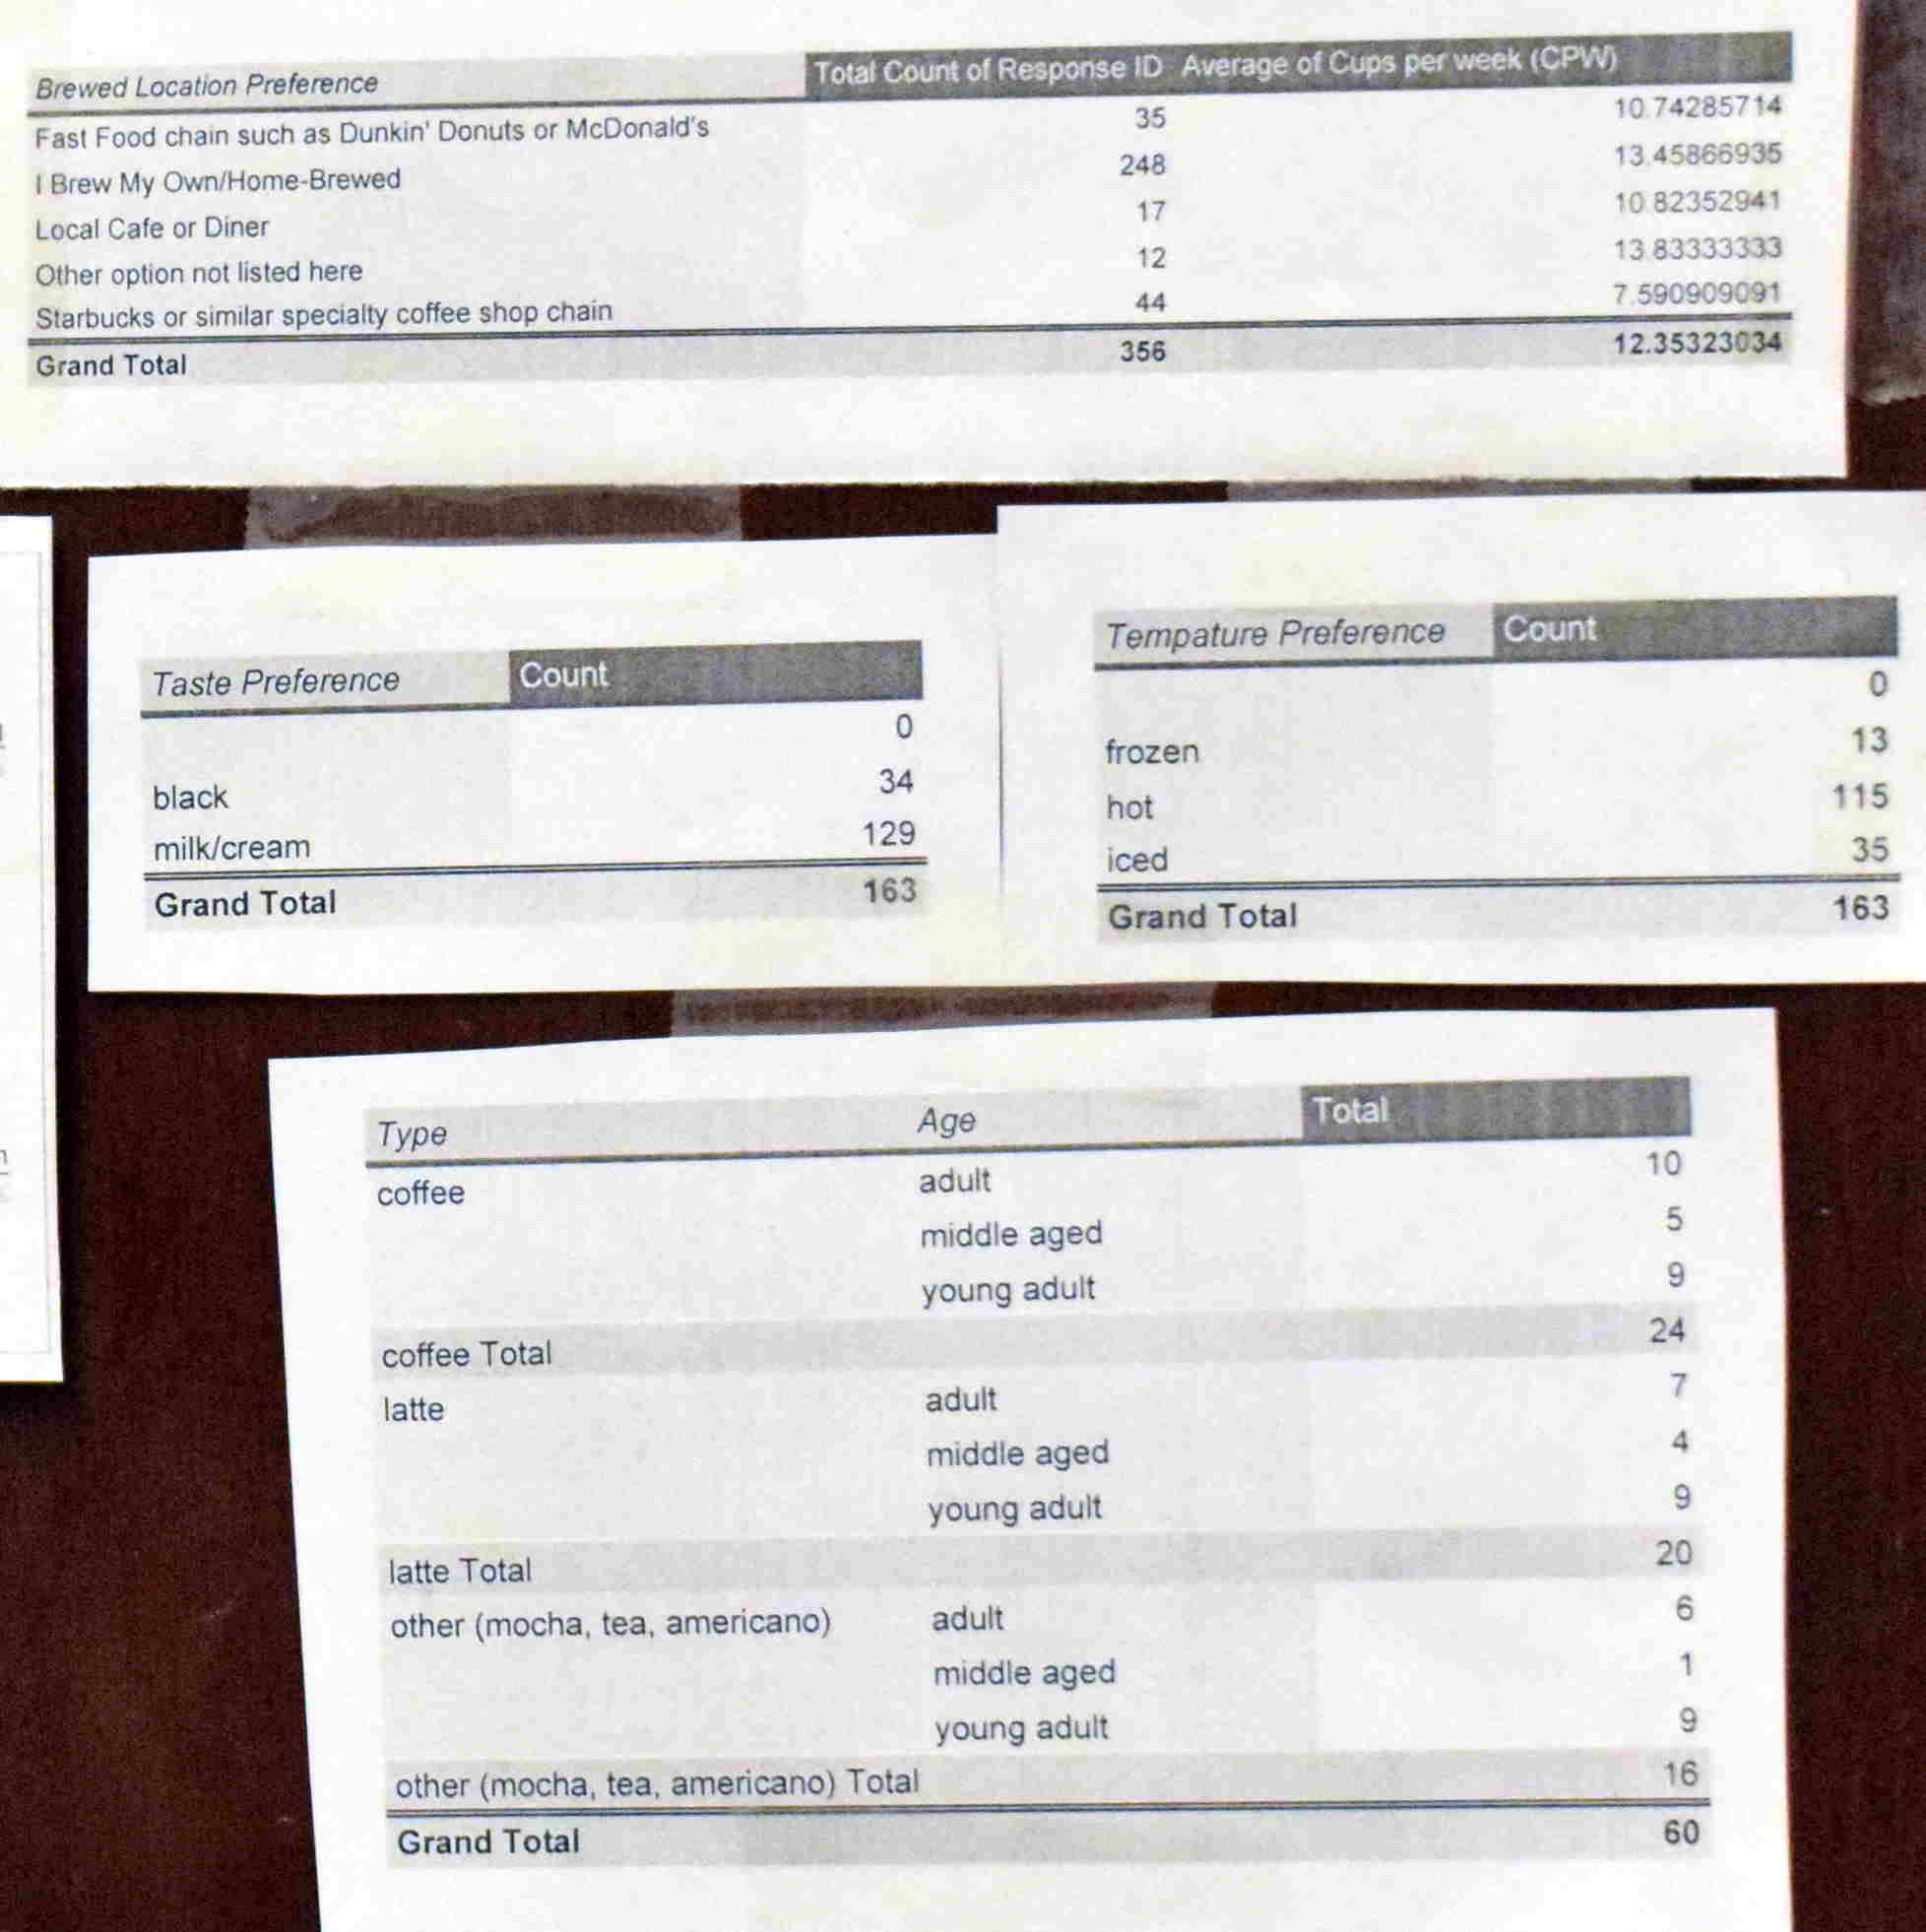
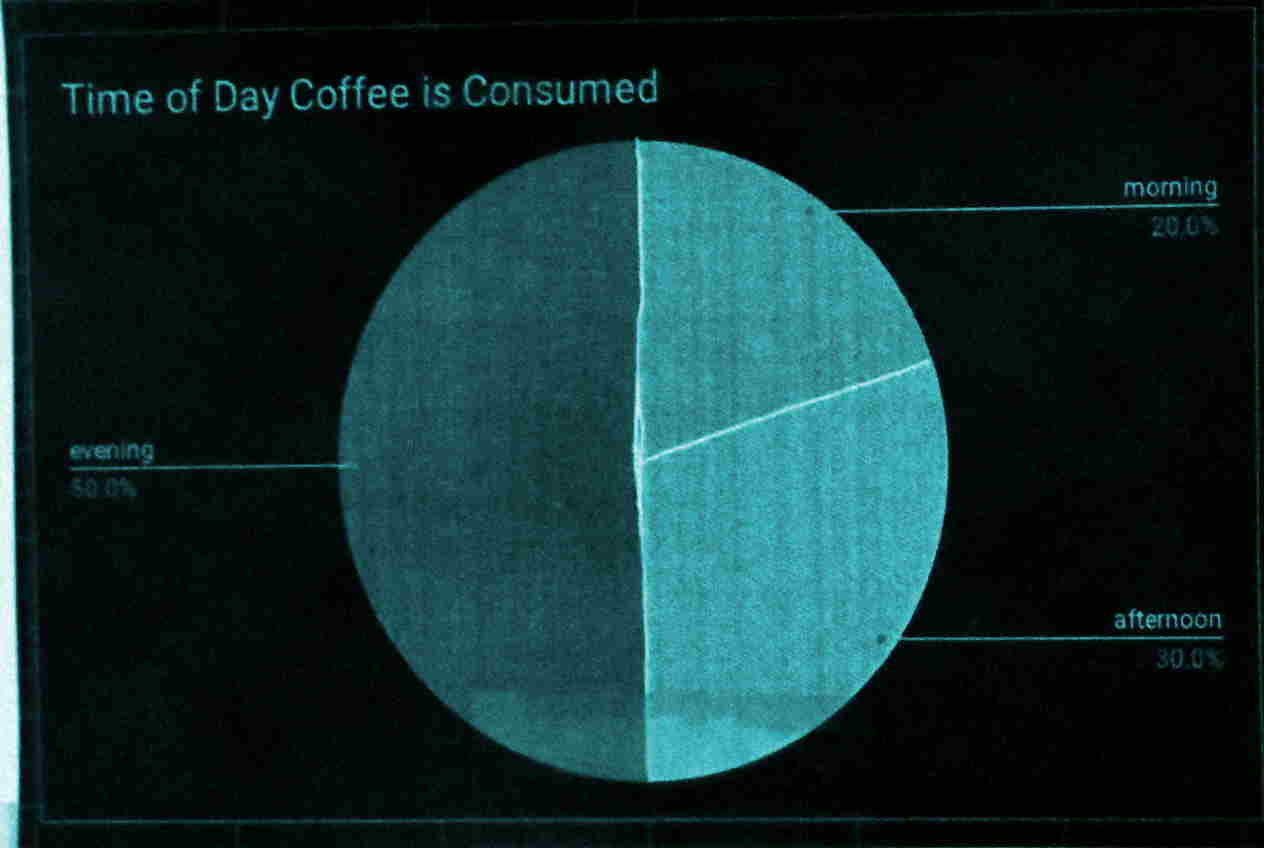
local_cafeCoffee preference survey analysis
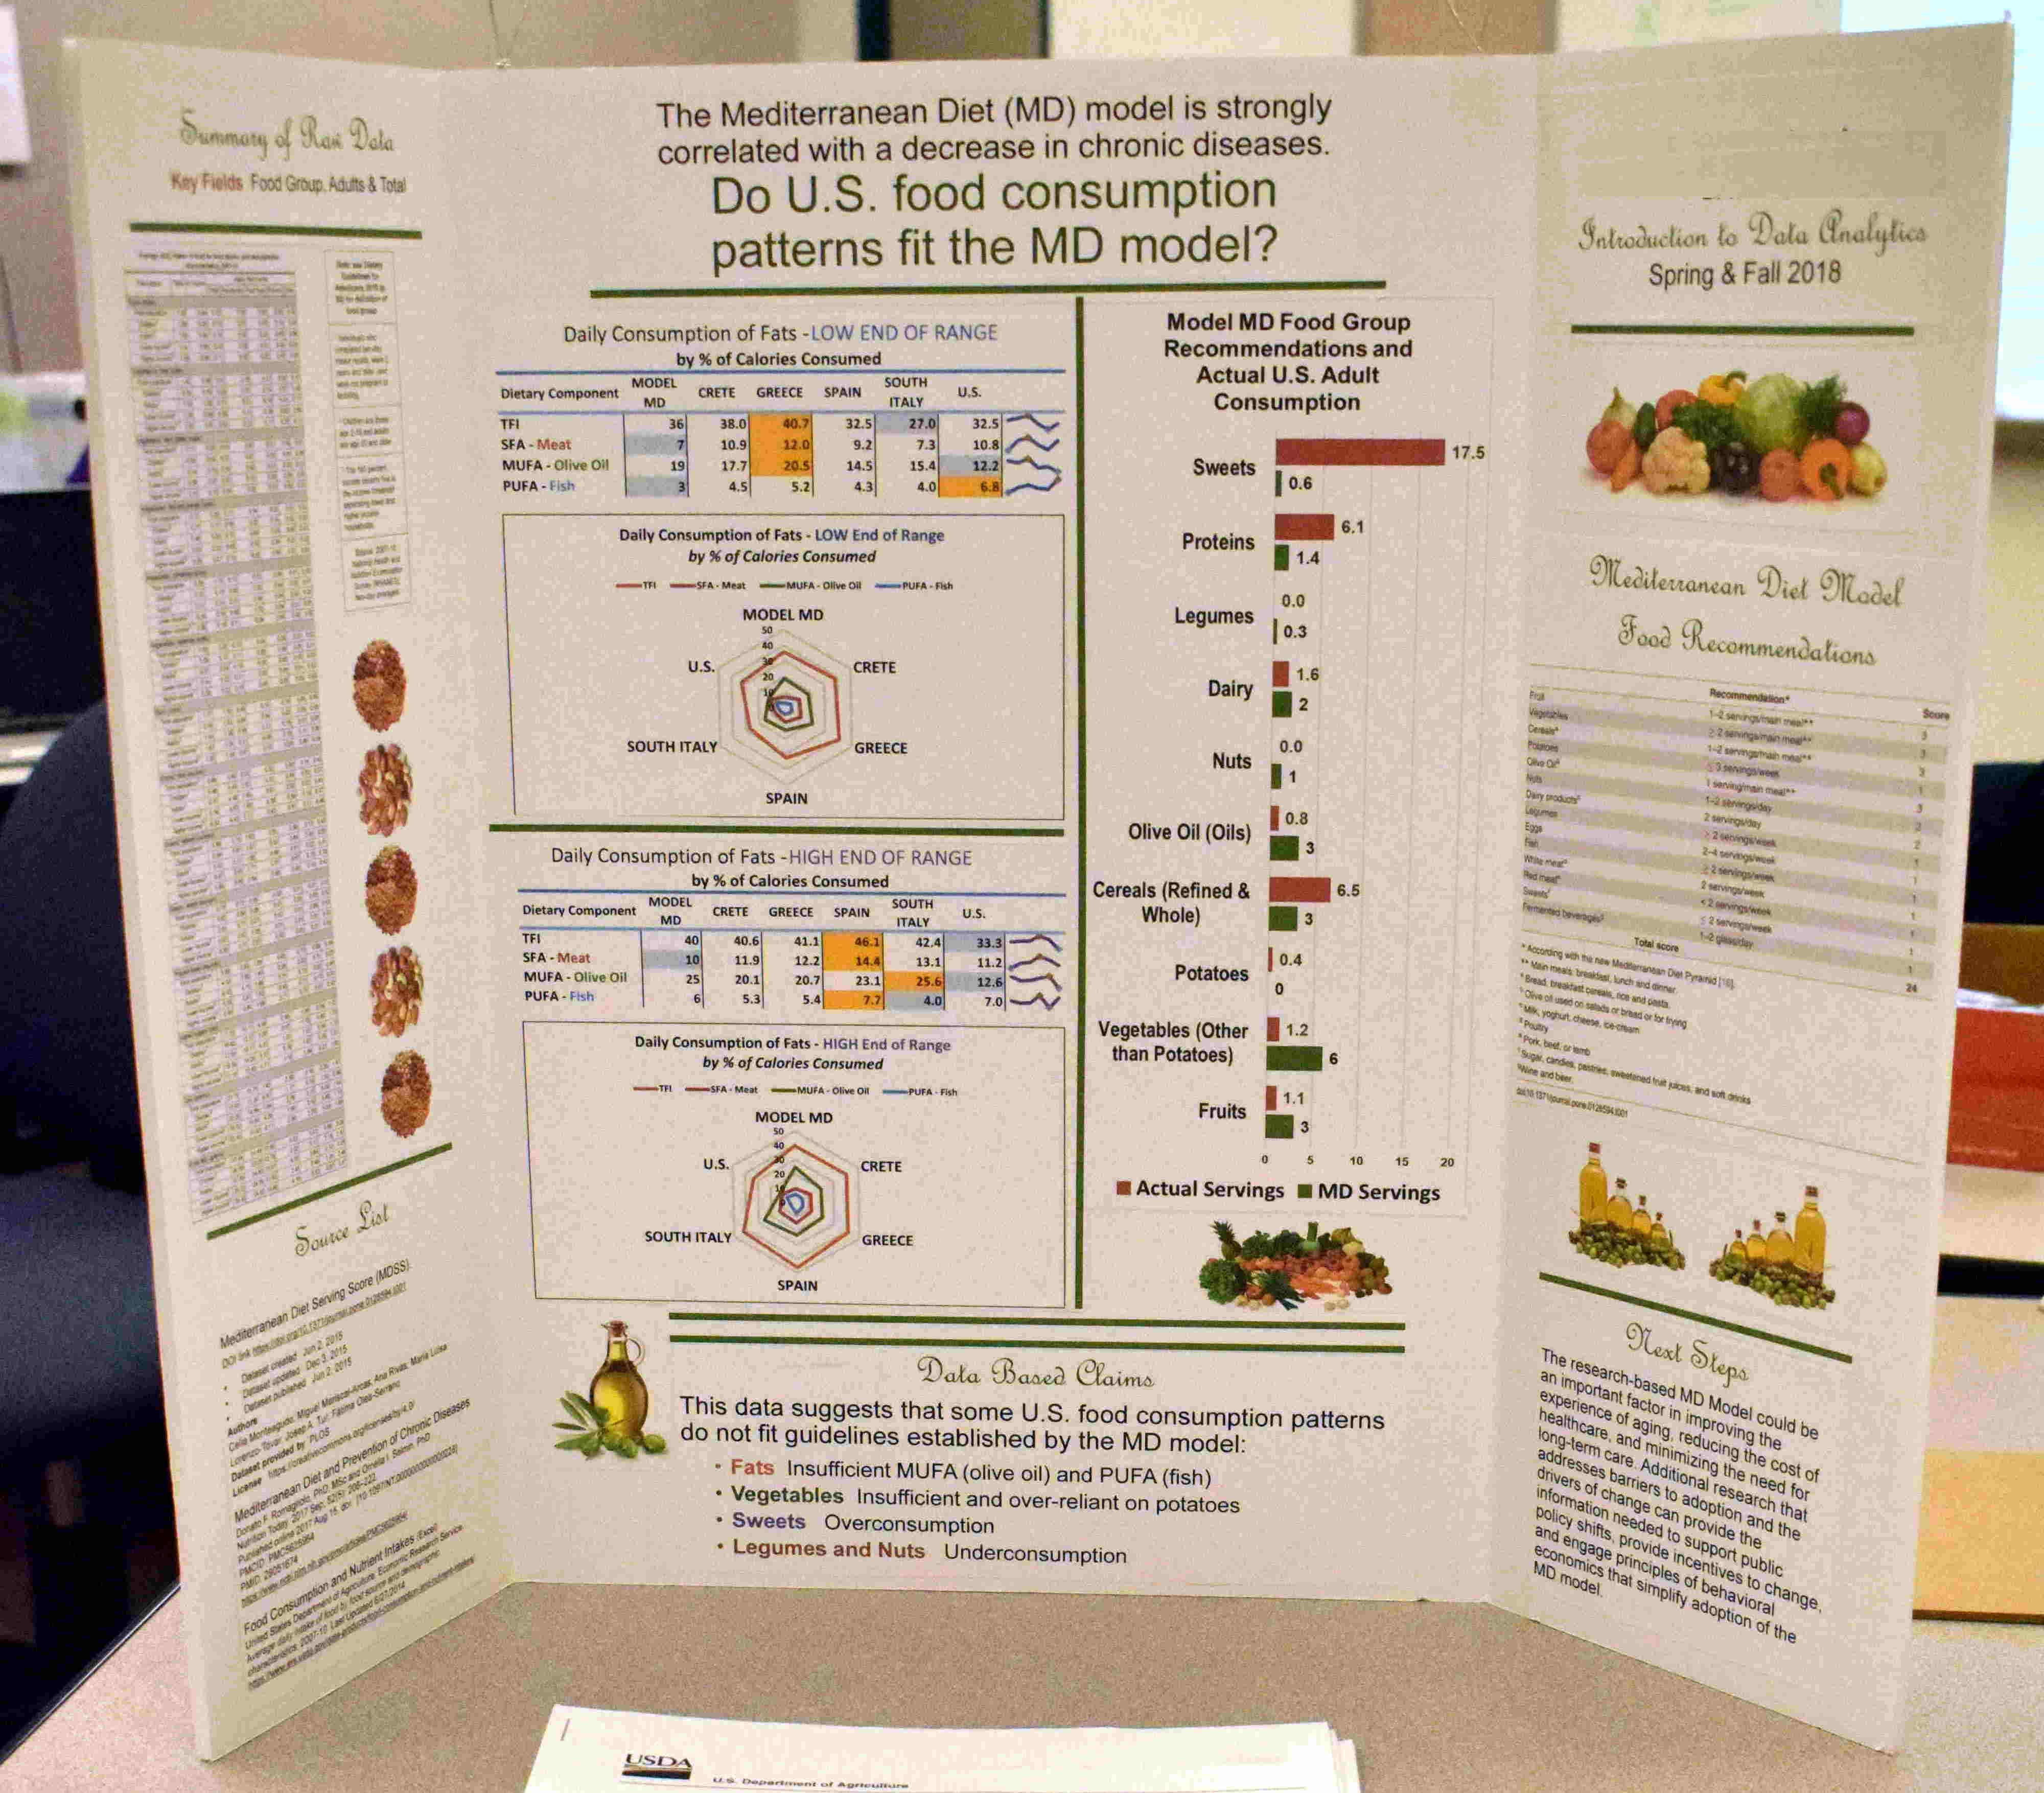
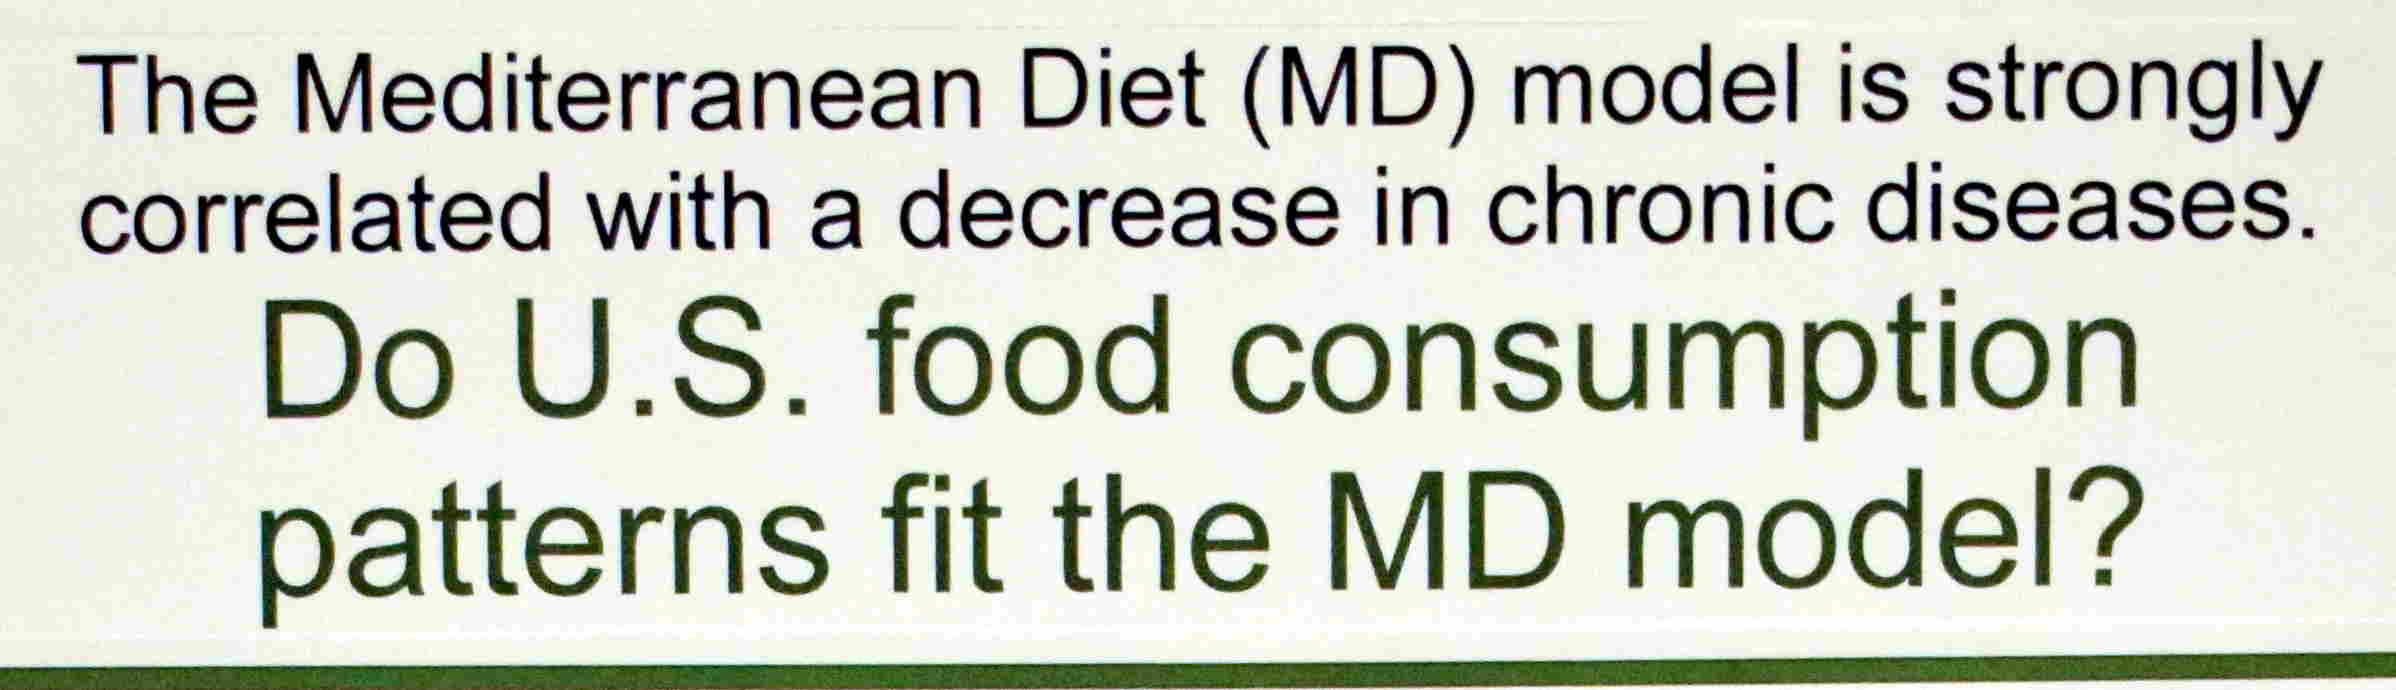
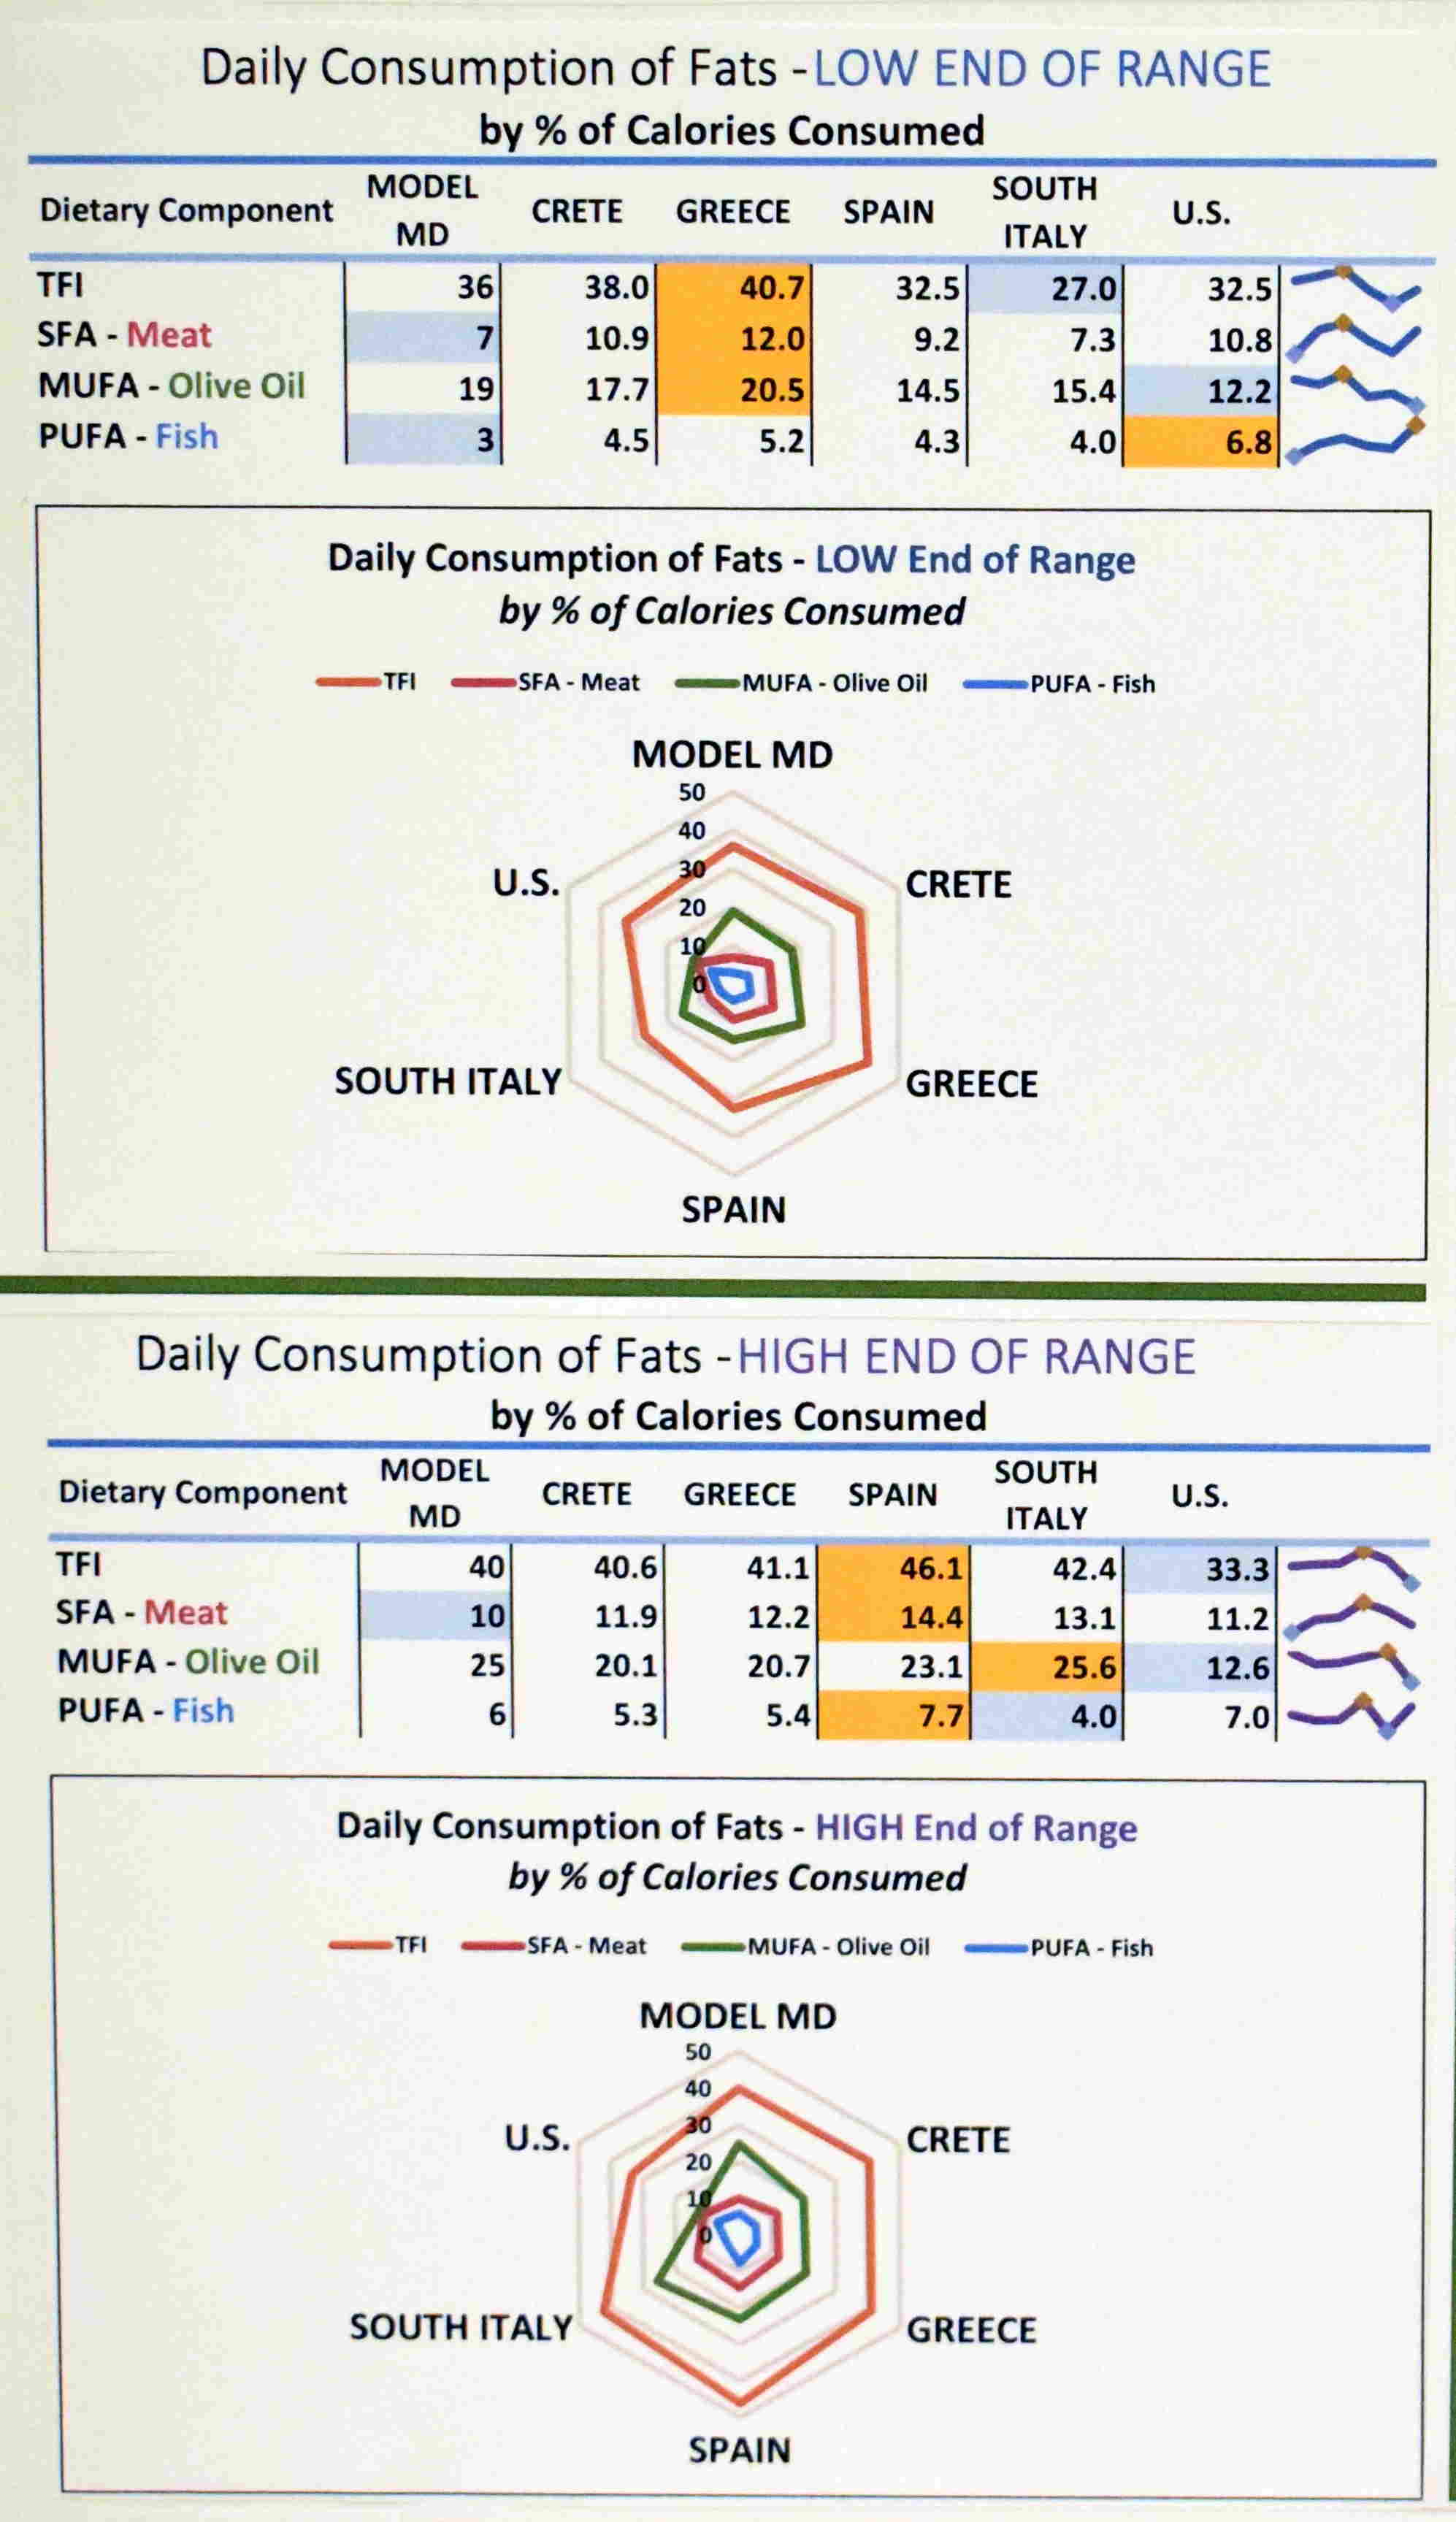
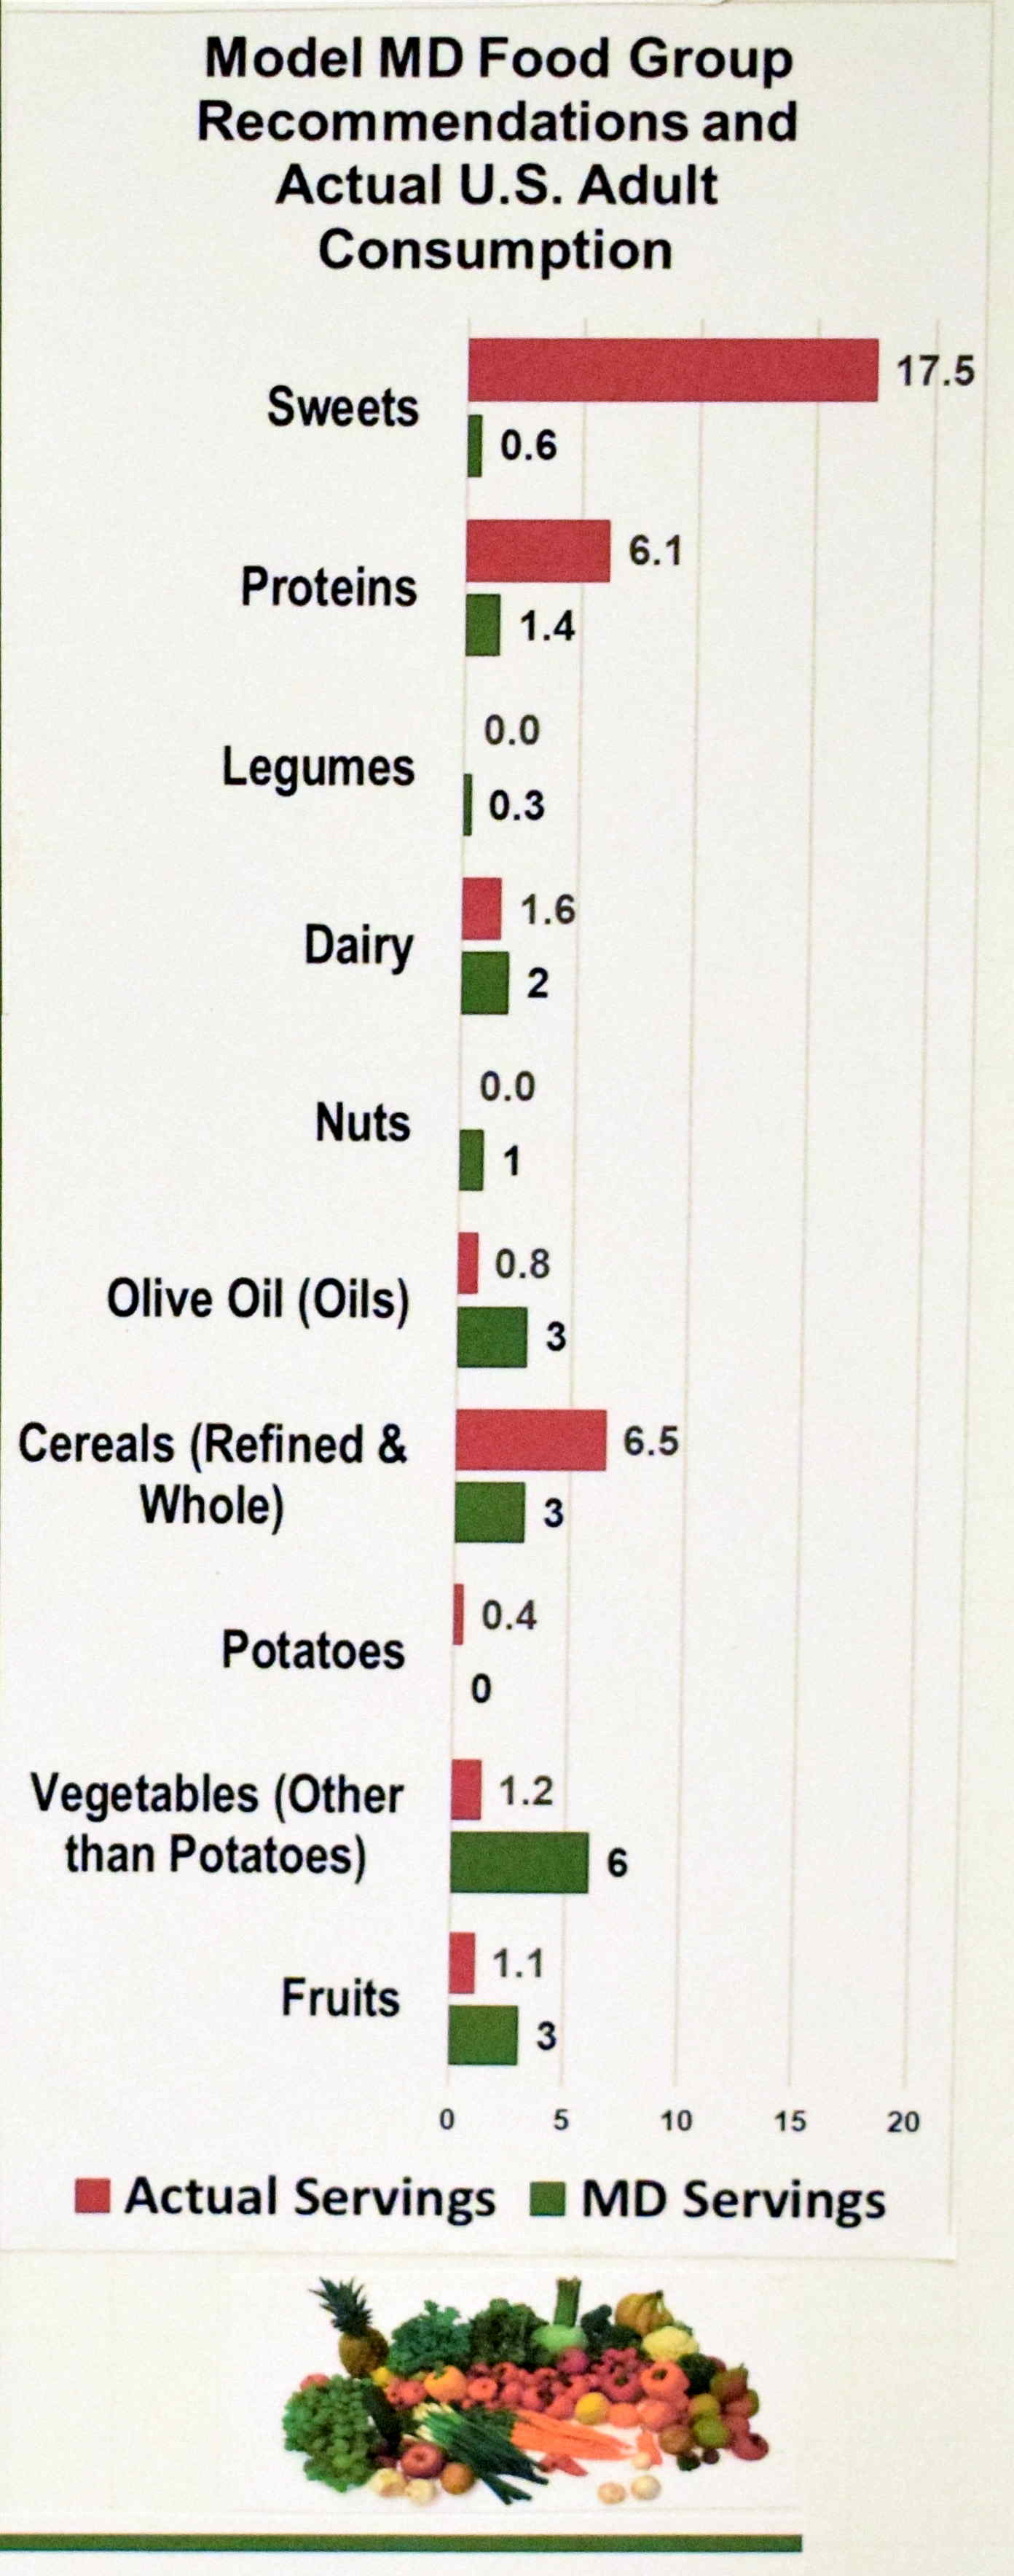
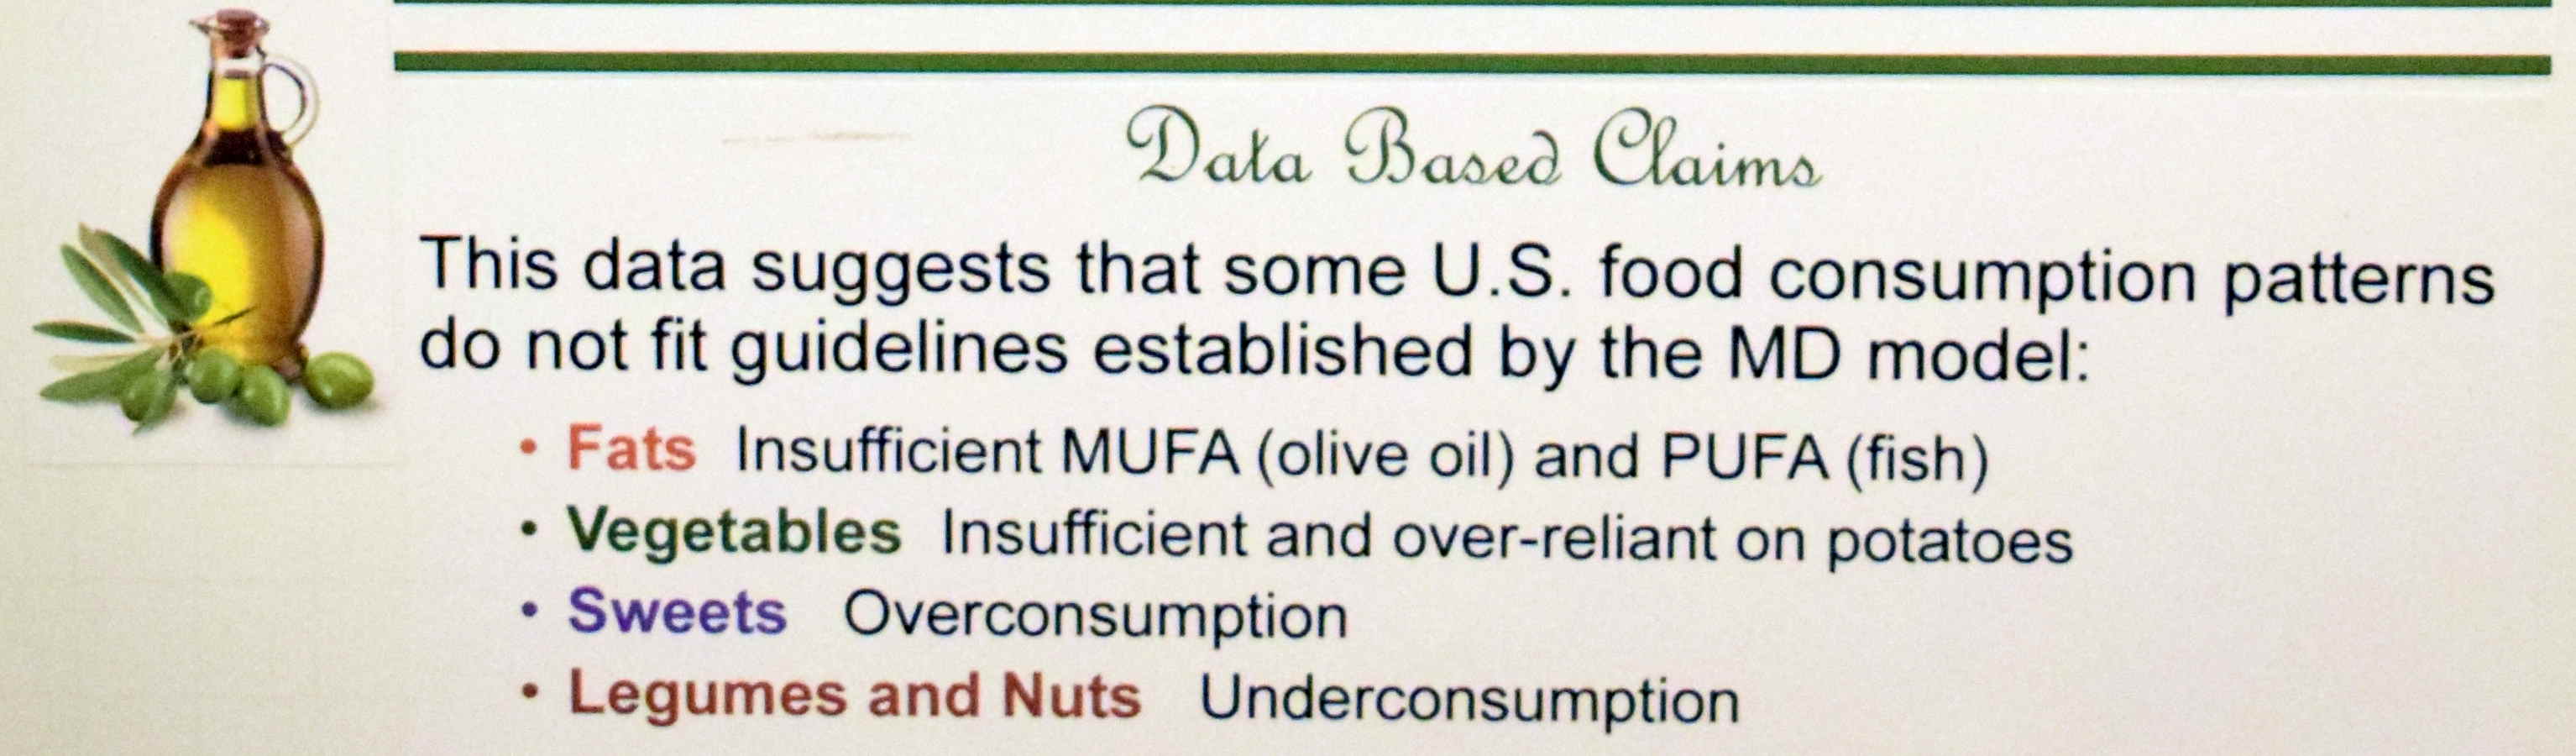
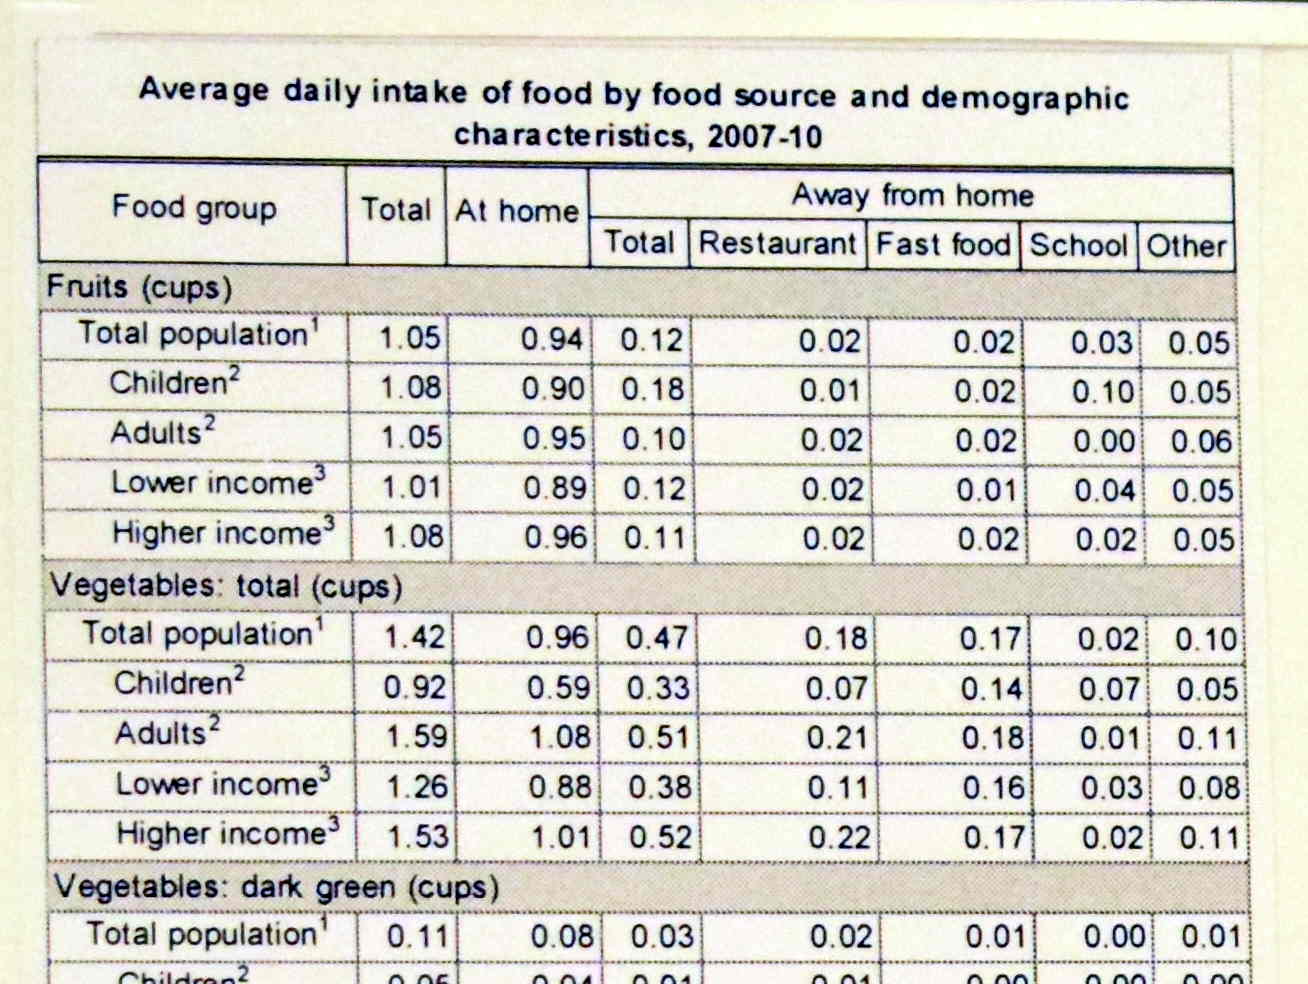
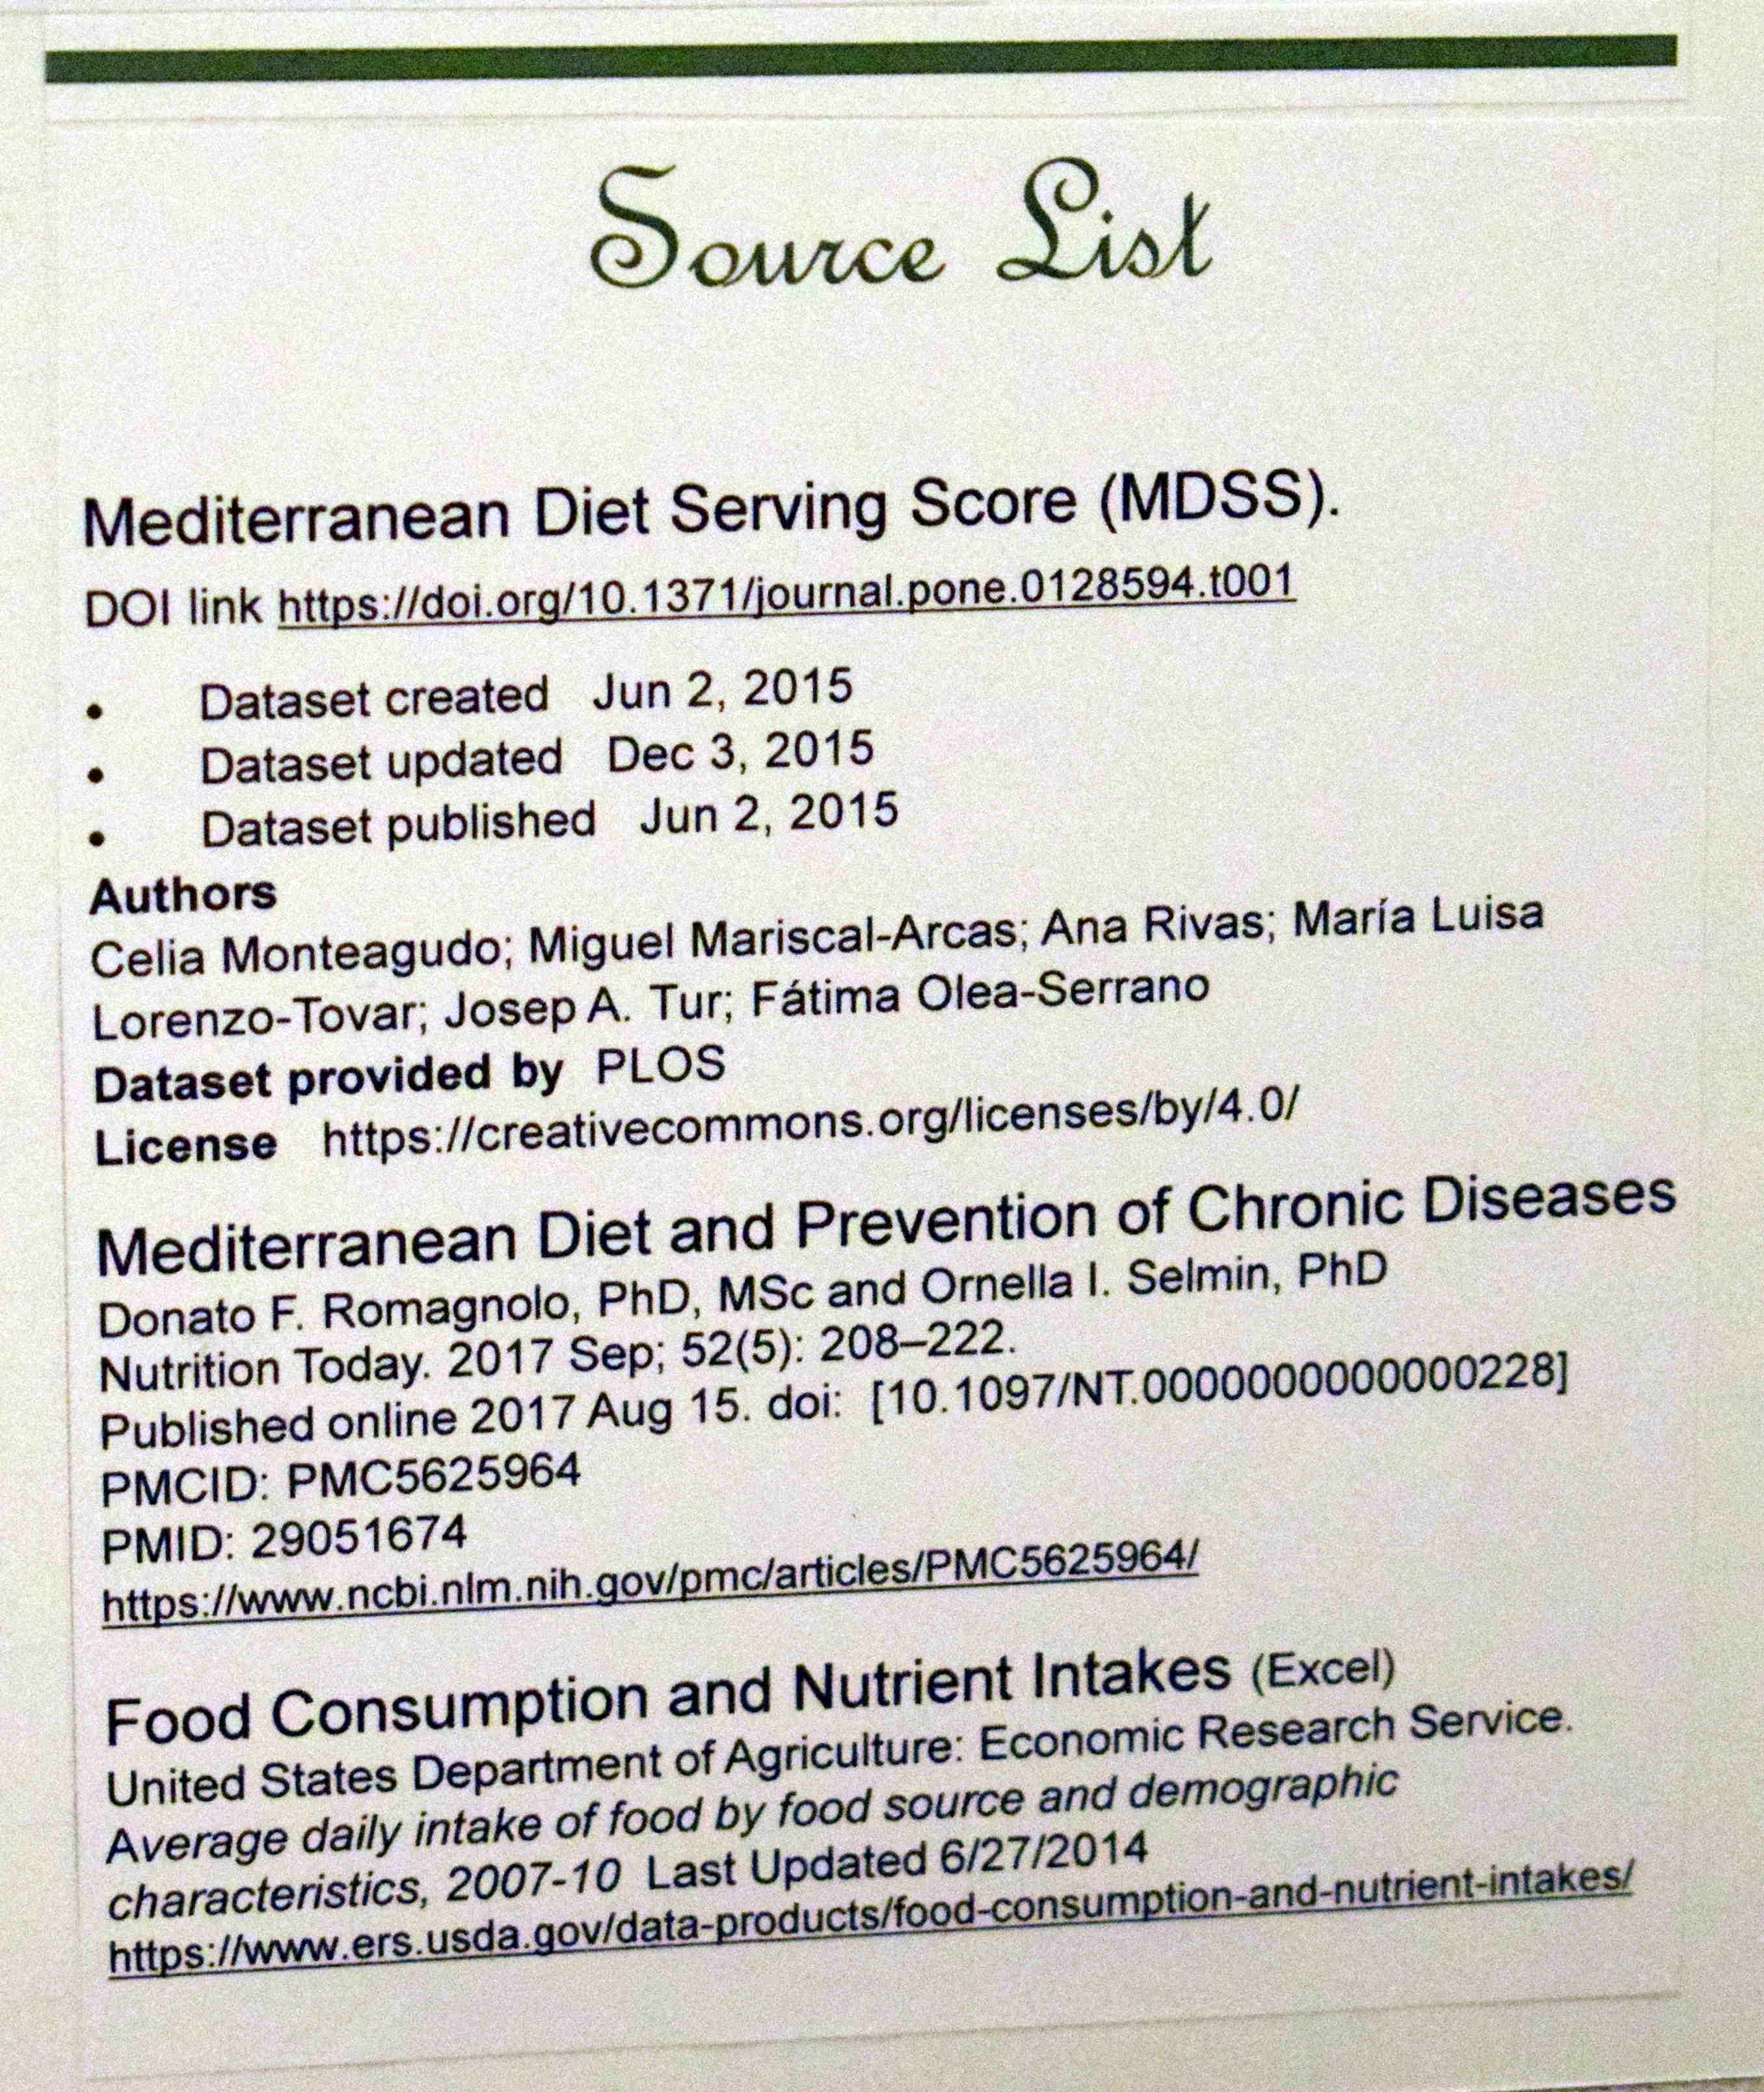
fastfoodMediterranean diet and chronic illness
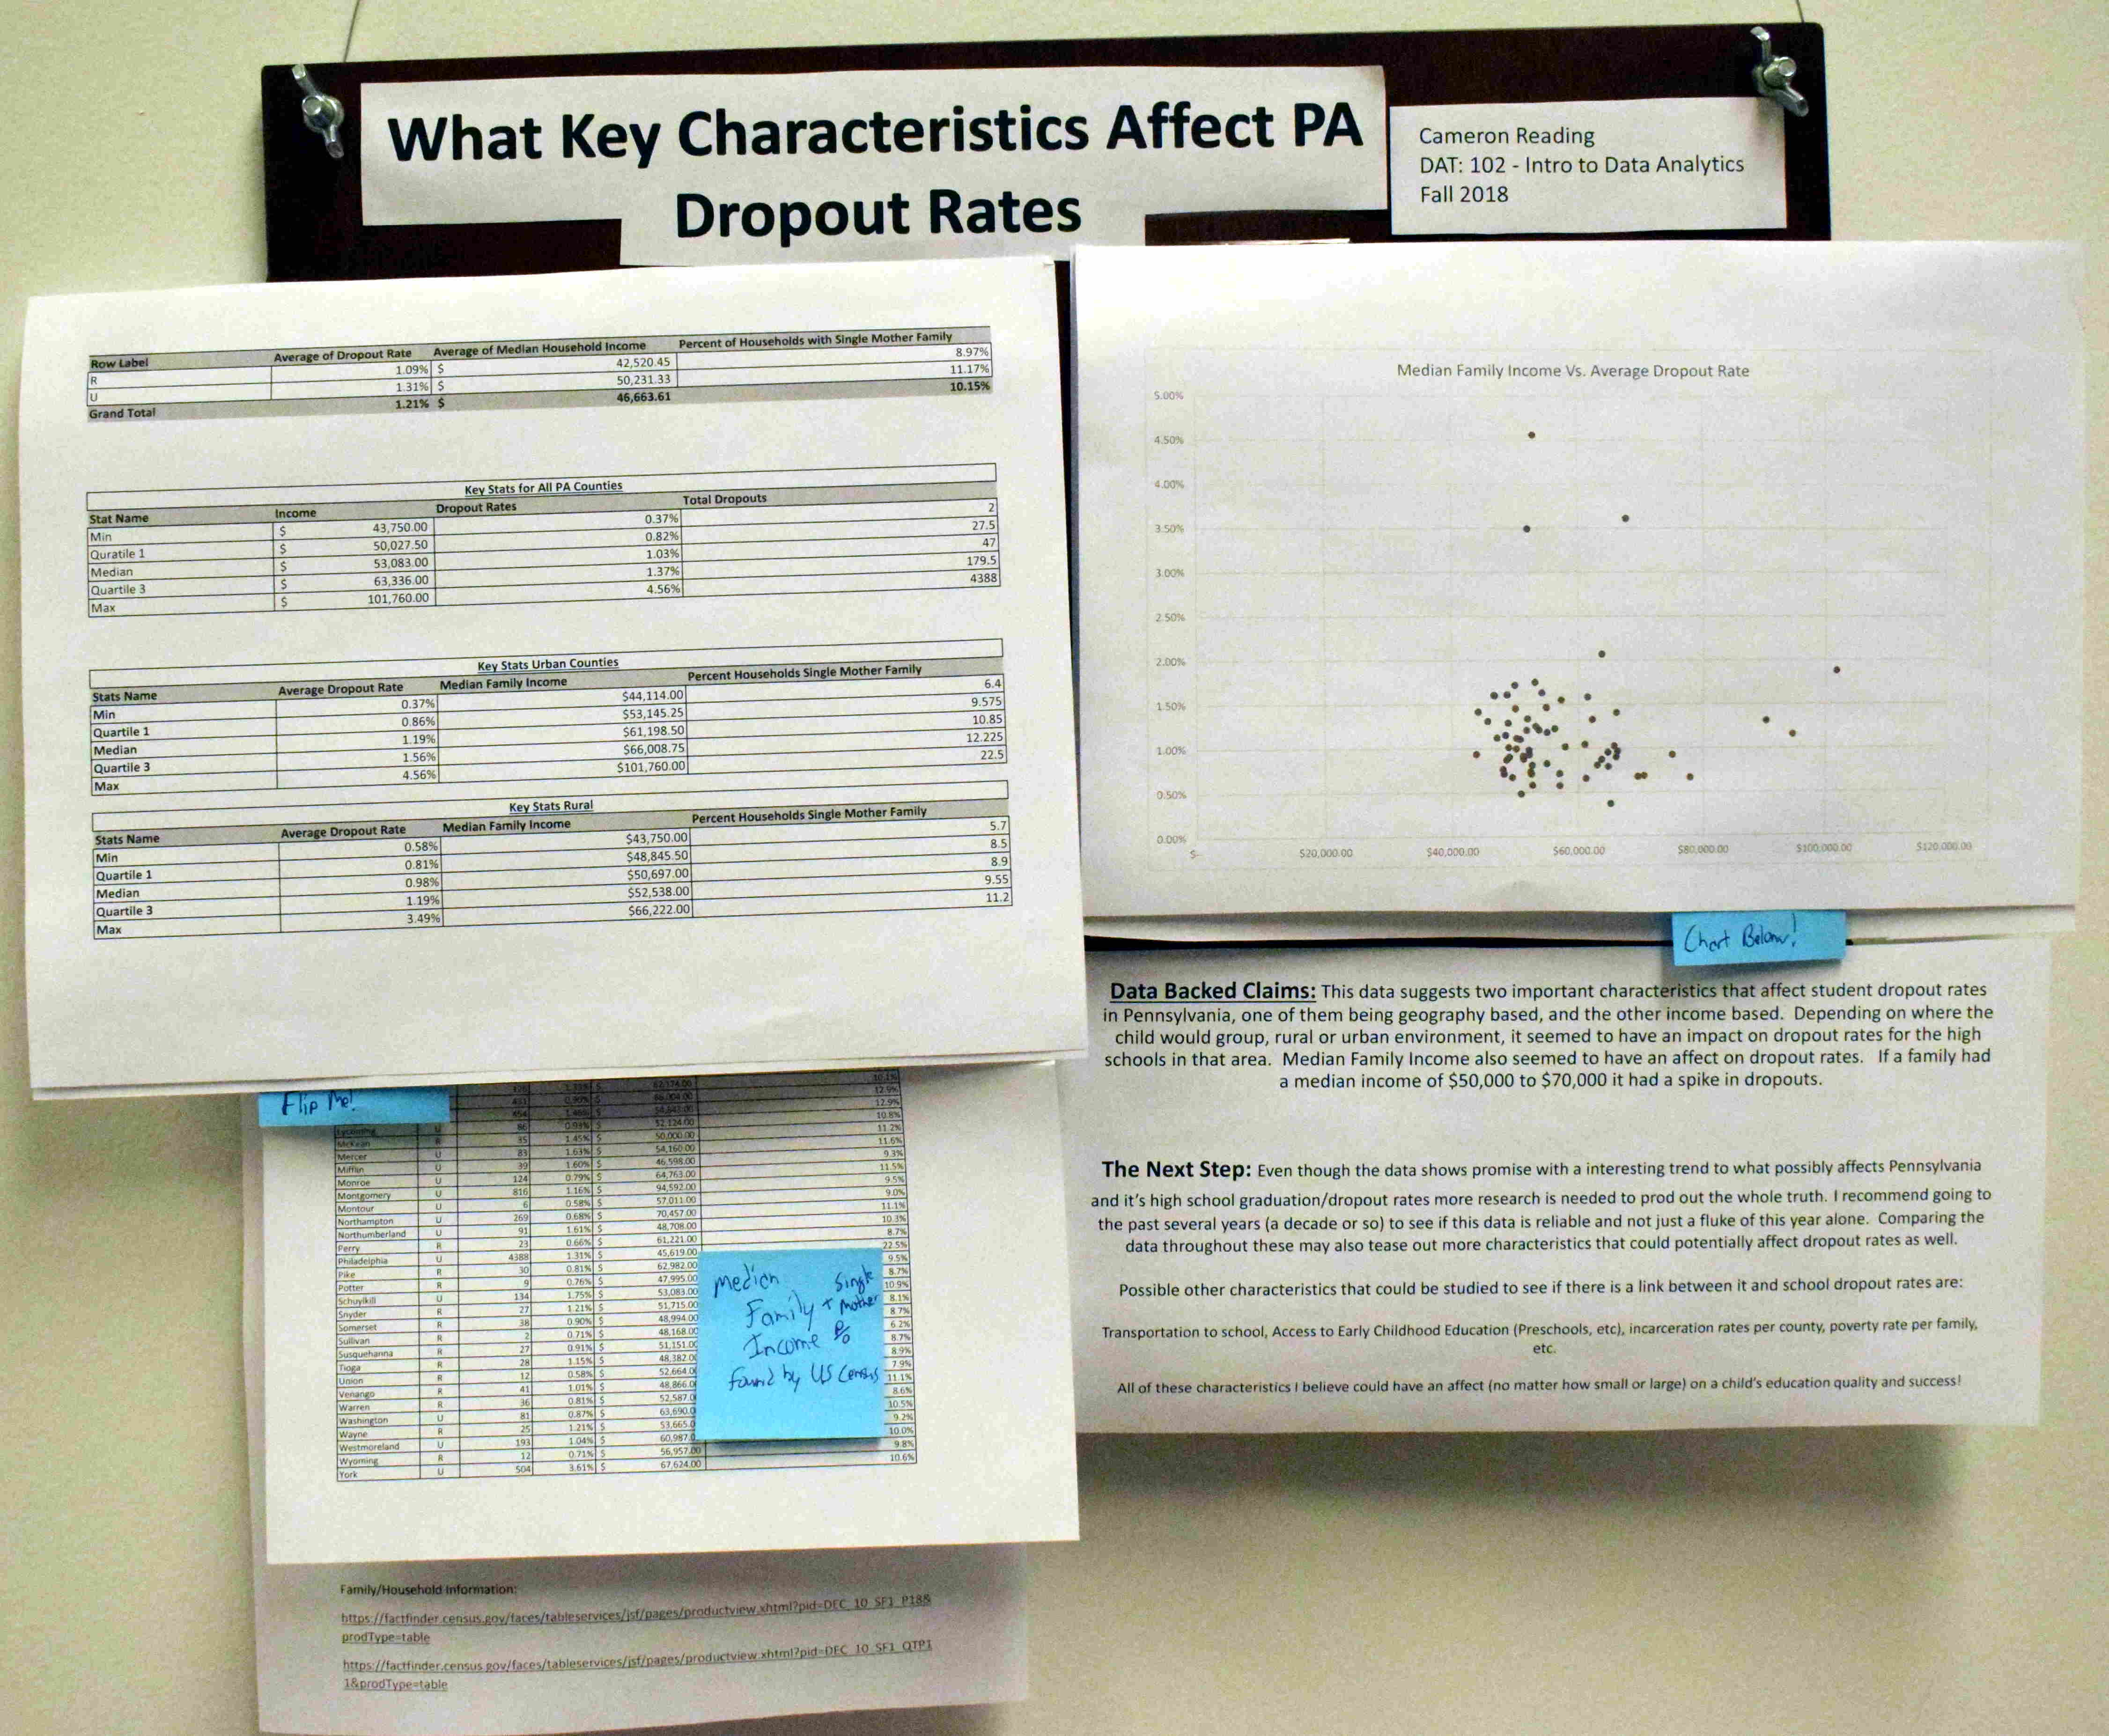
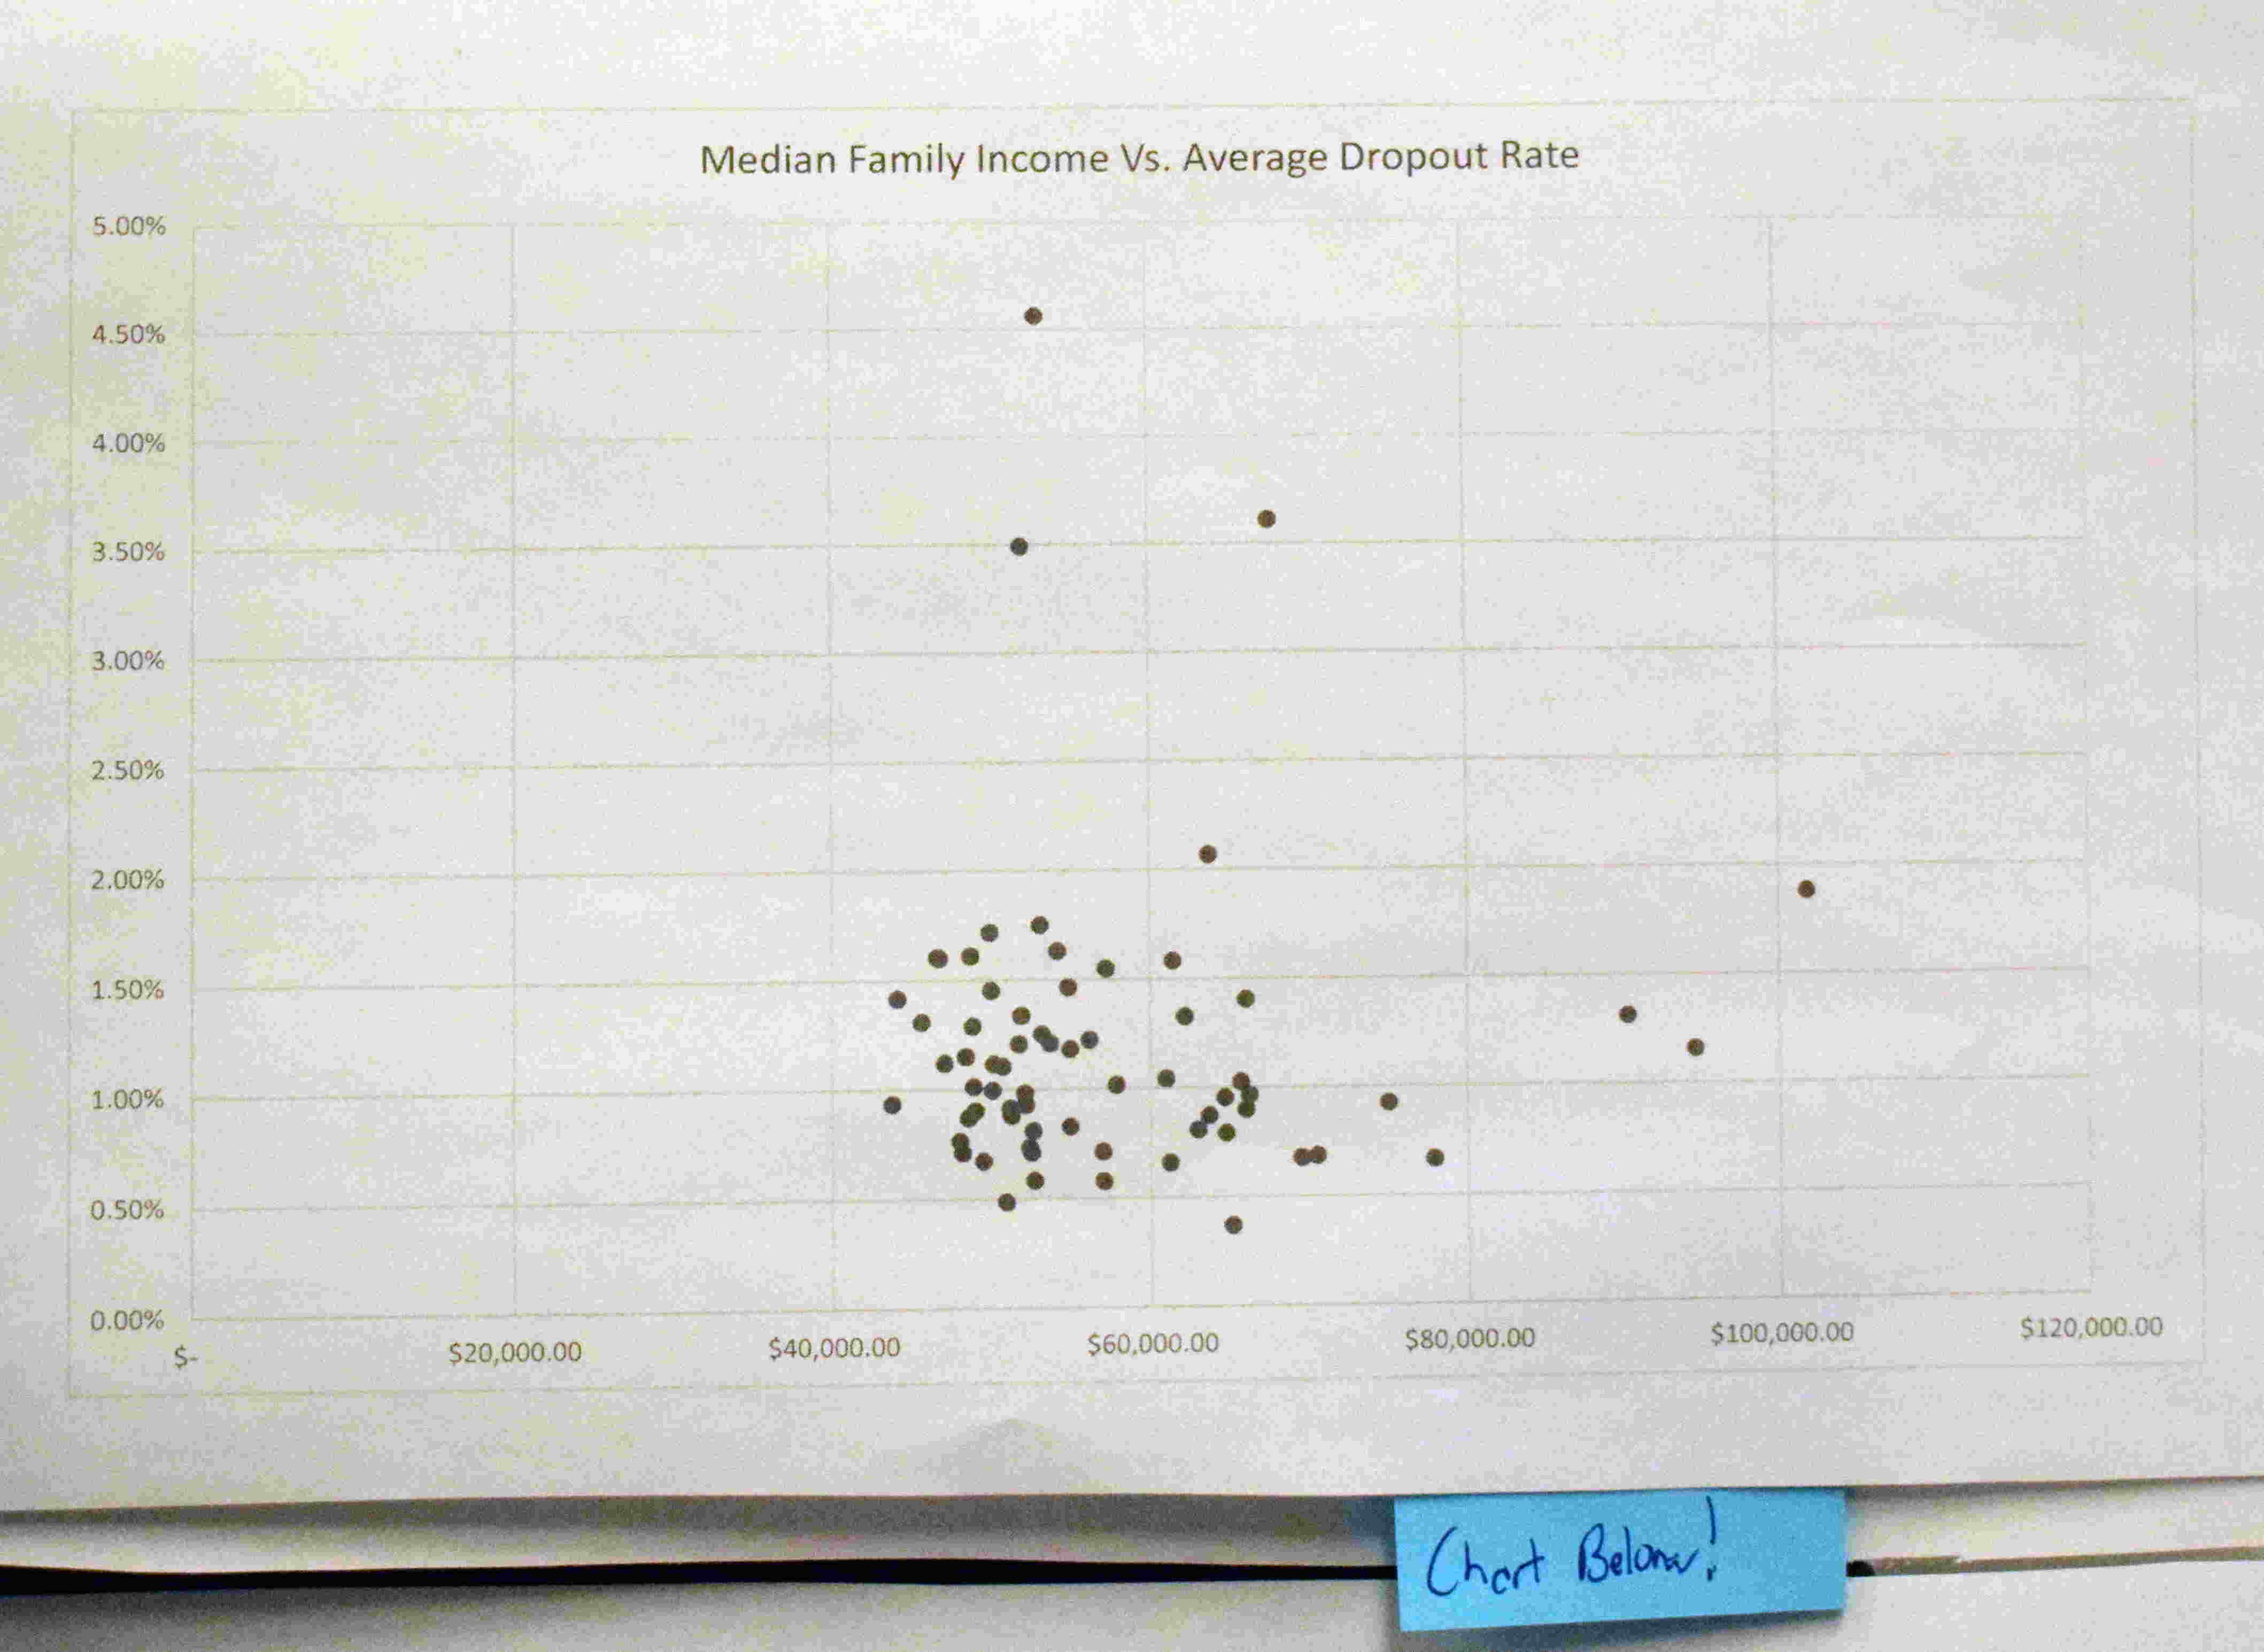
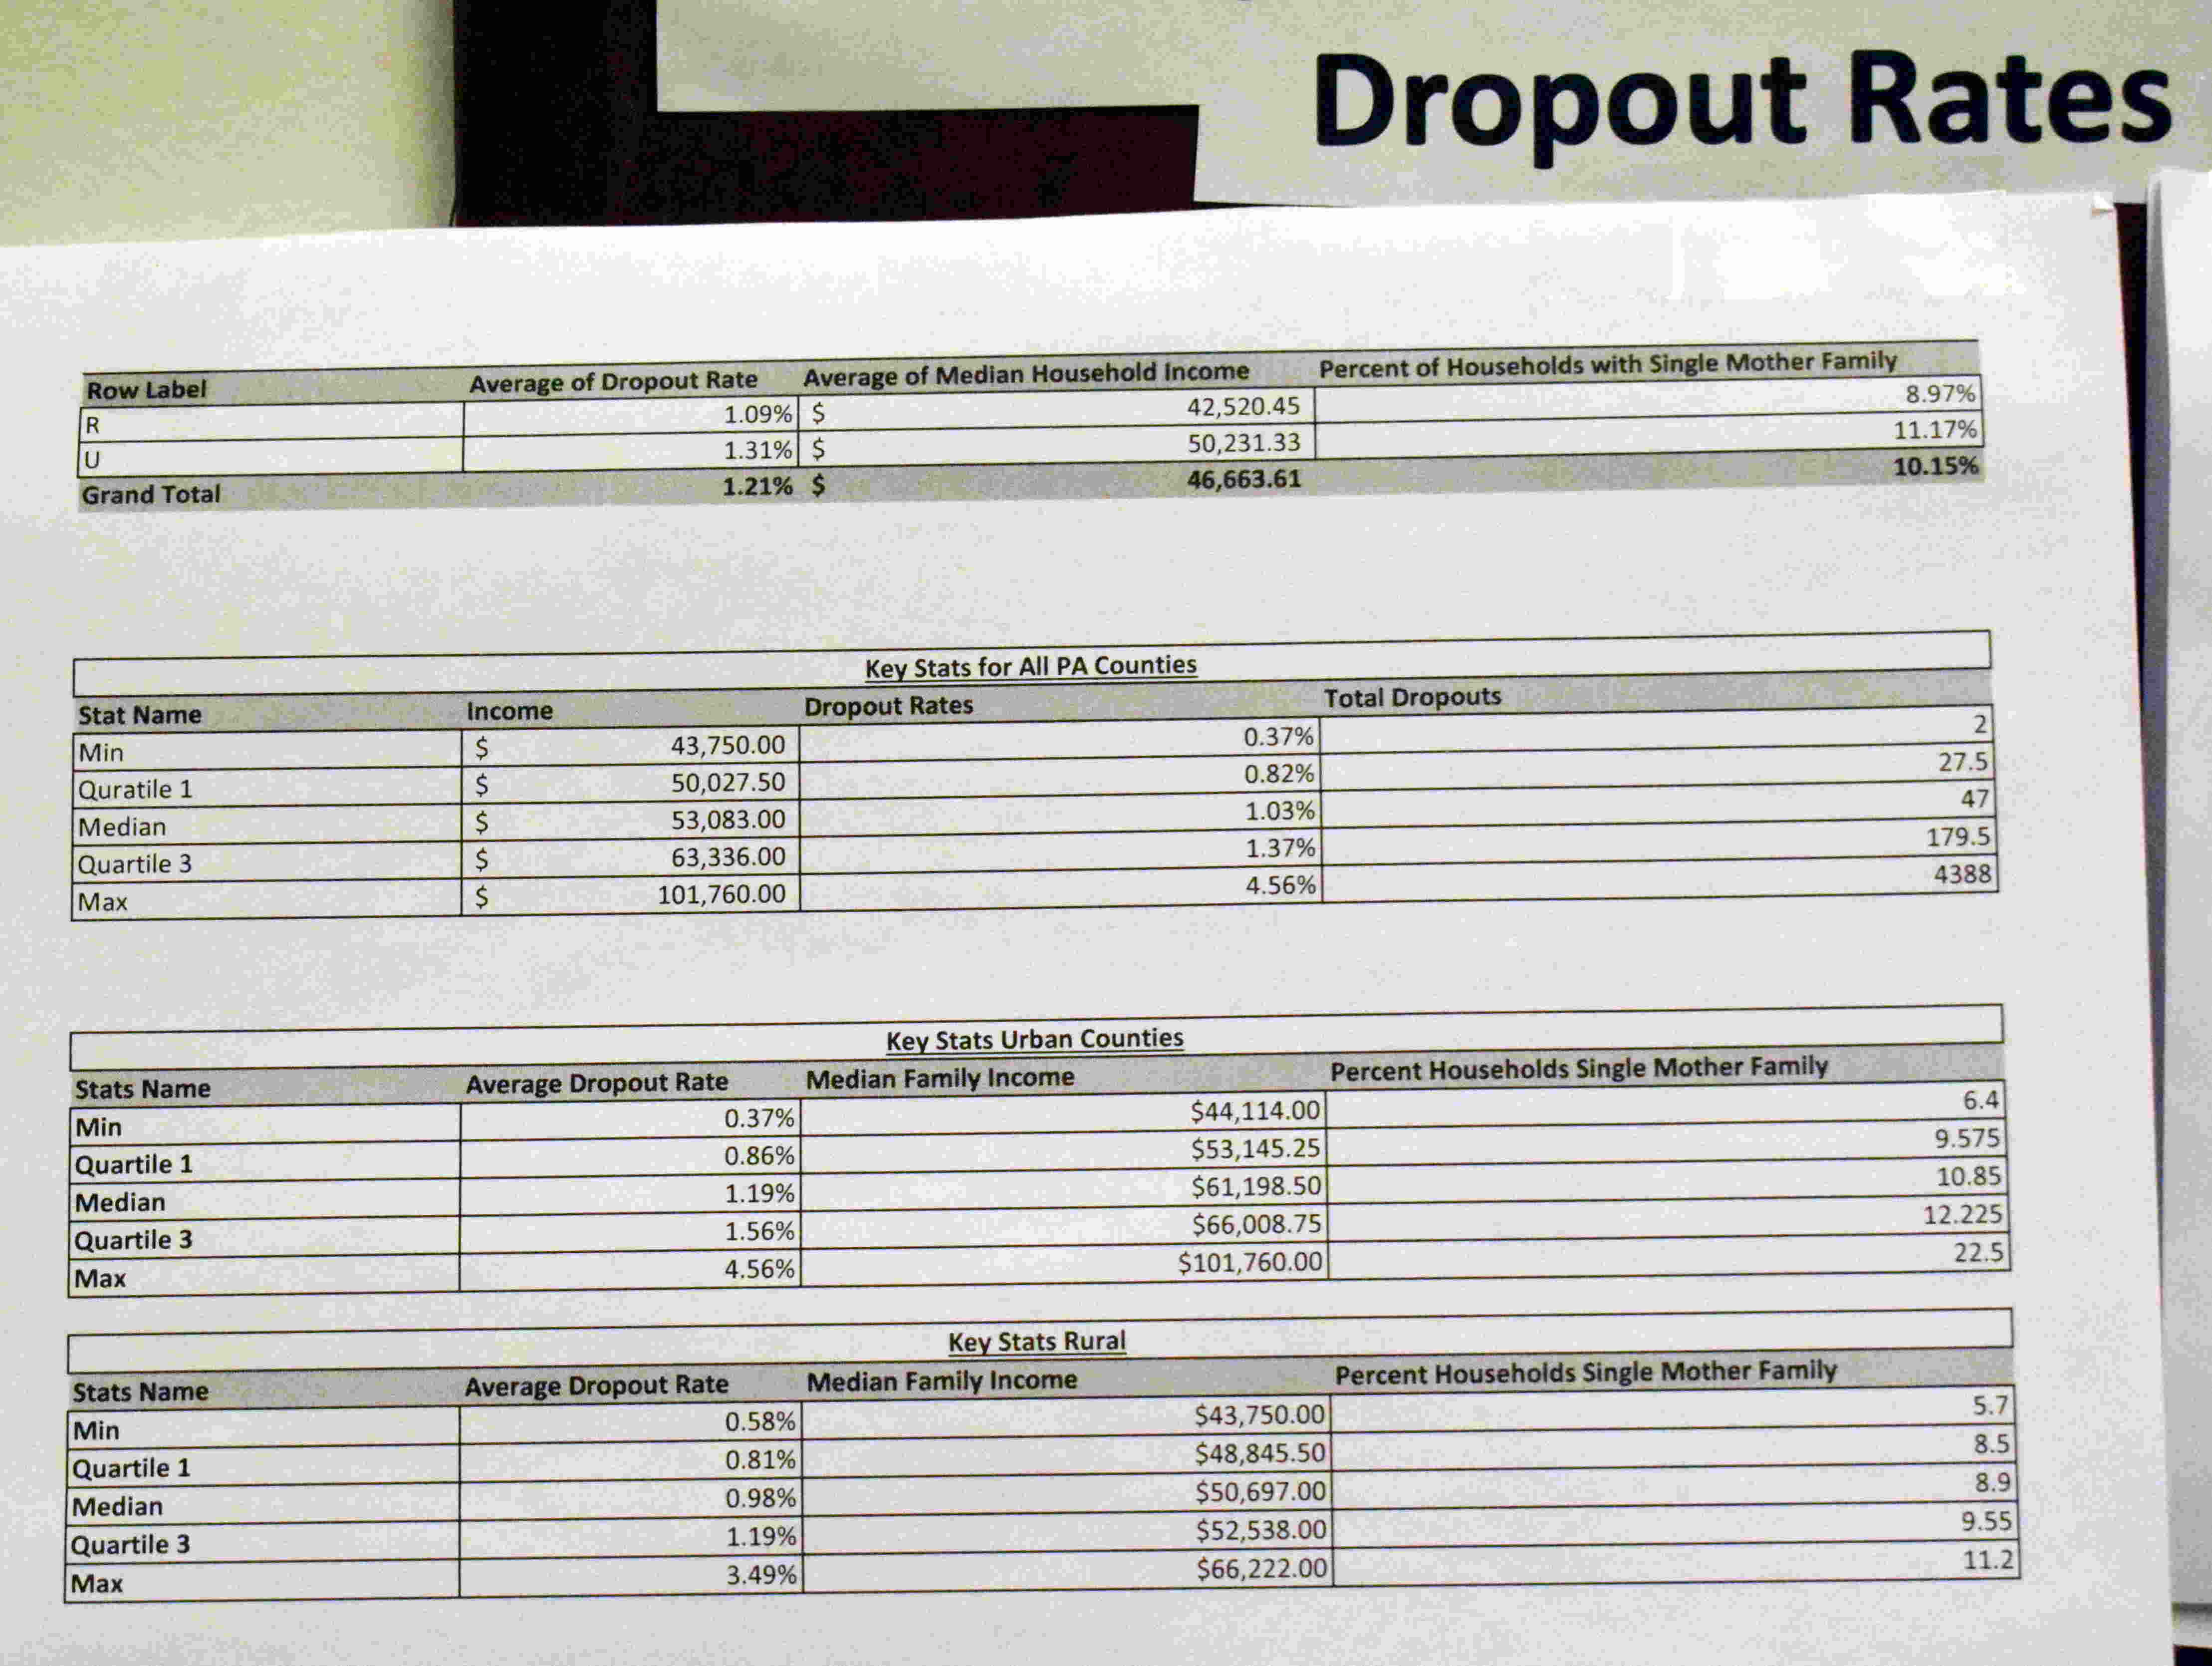
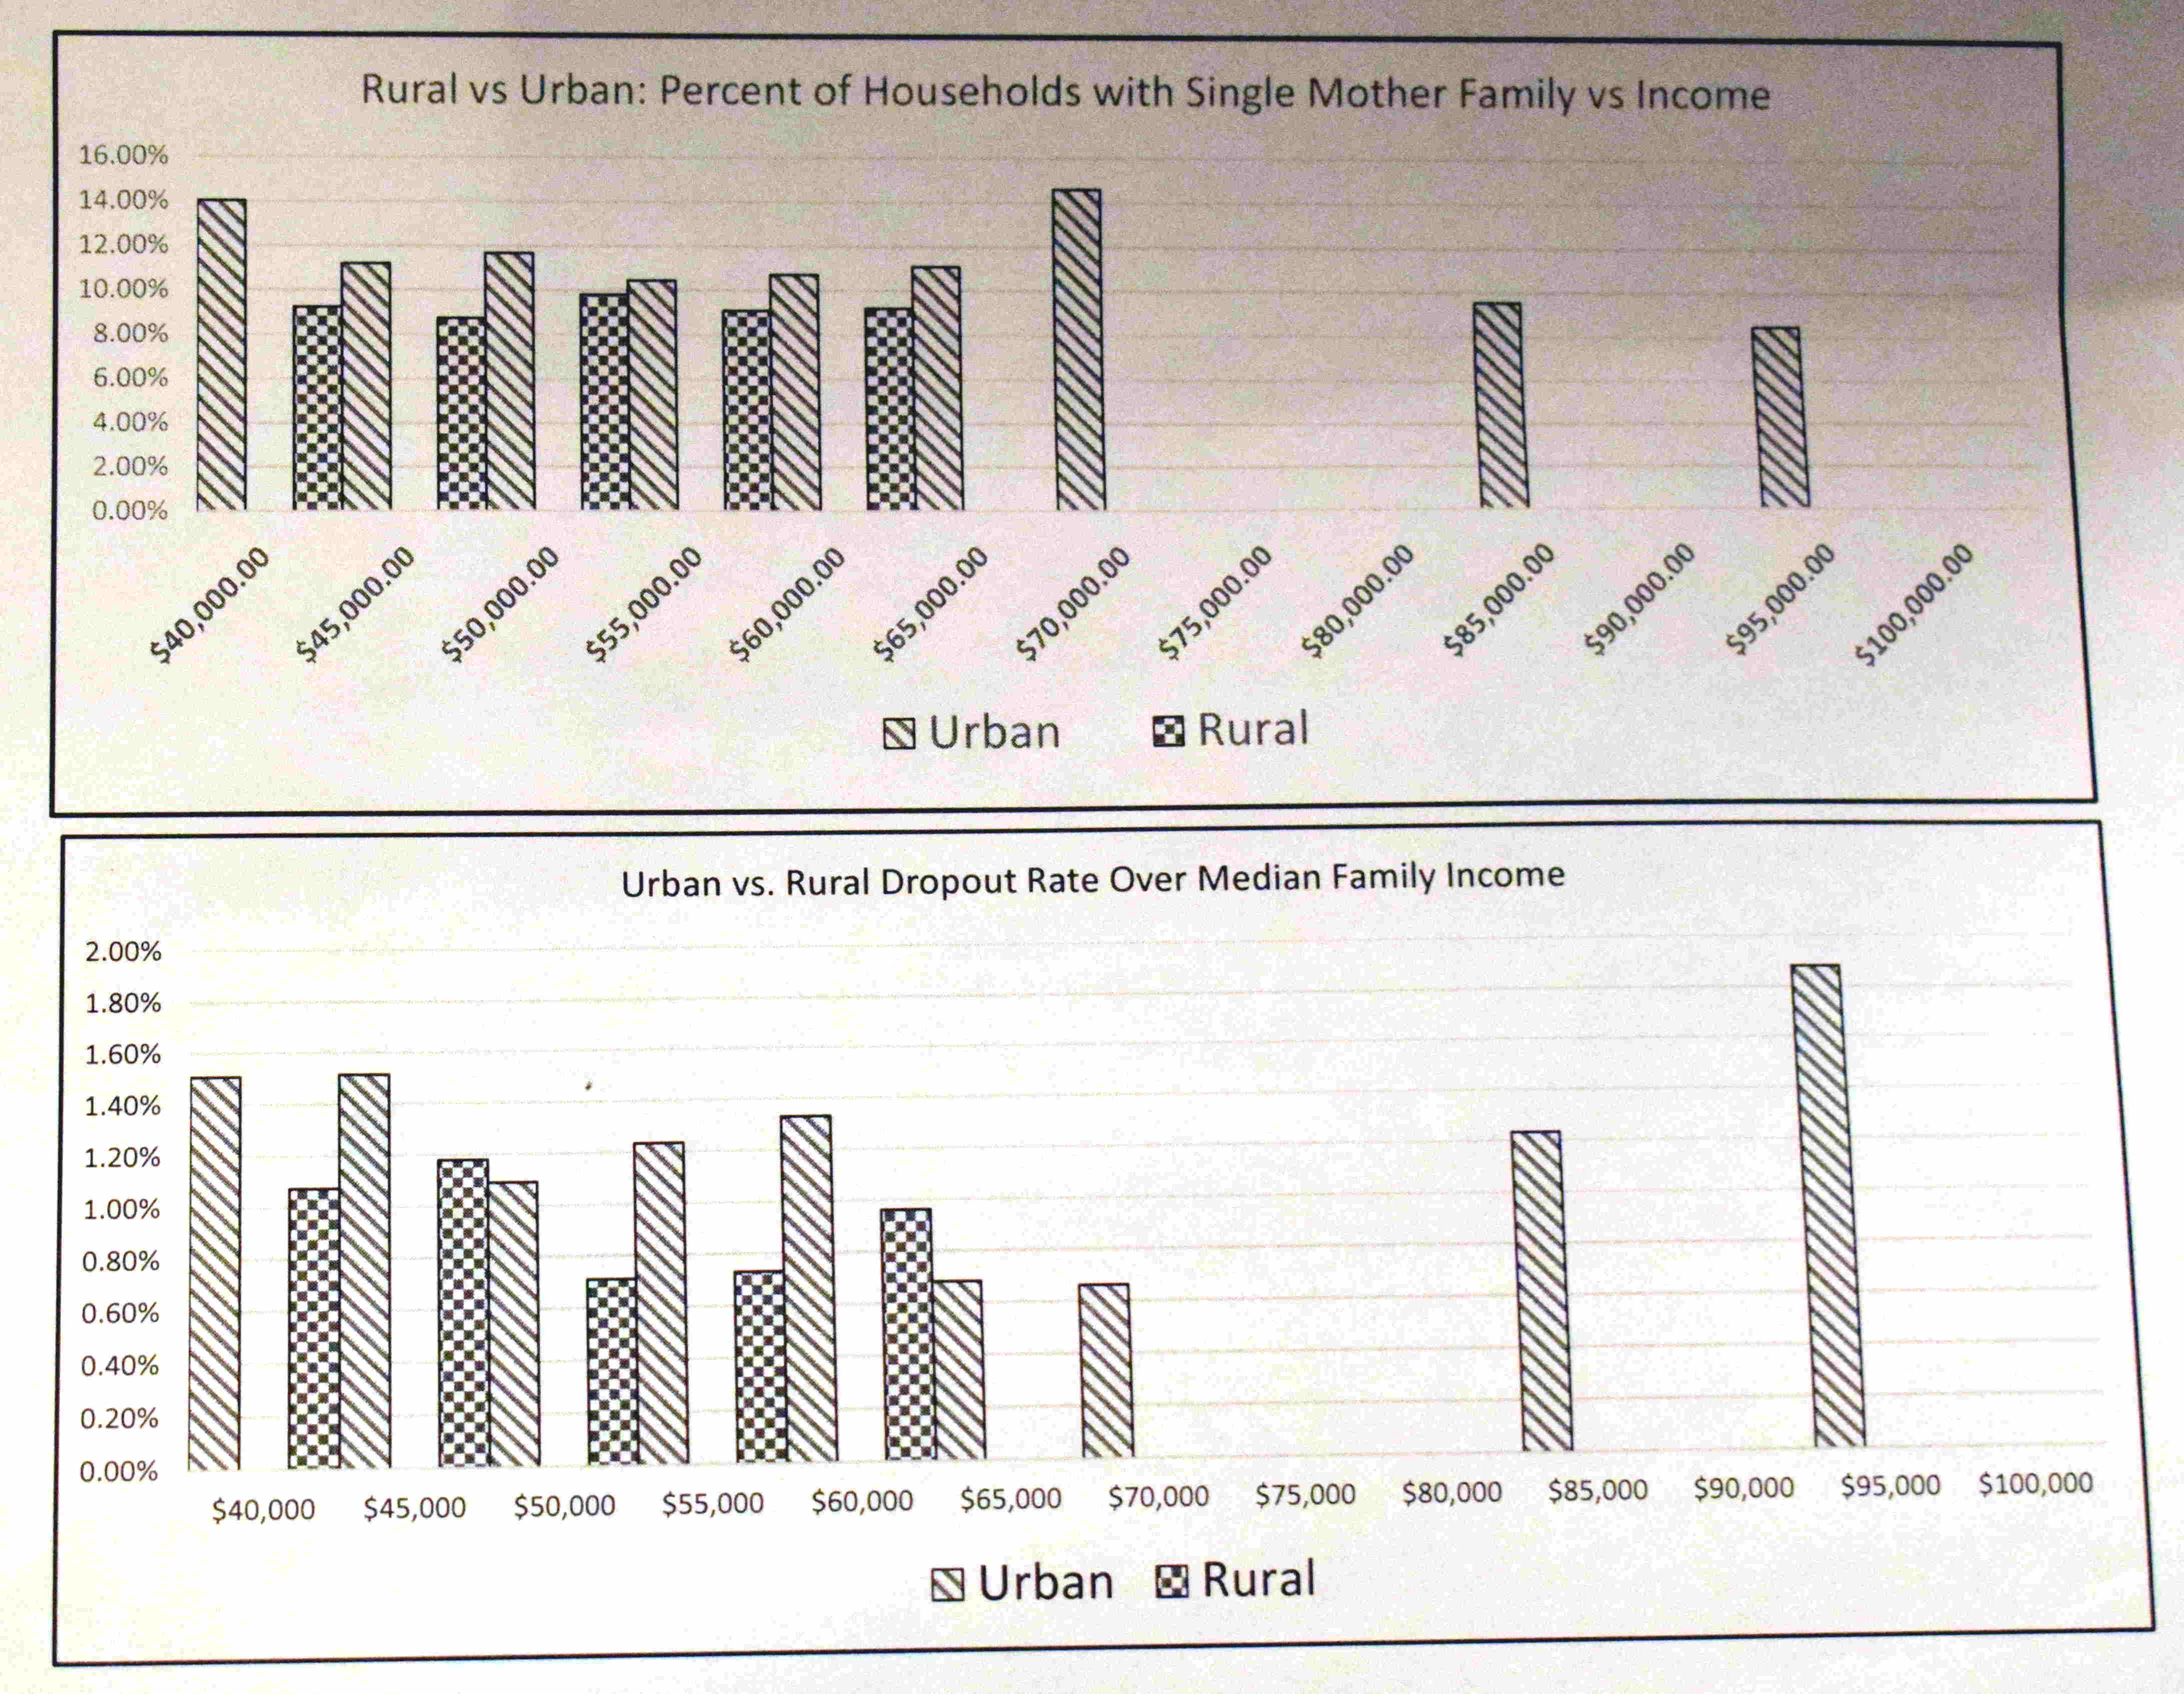
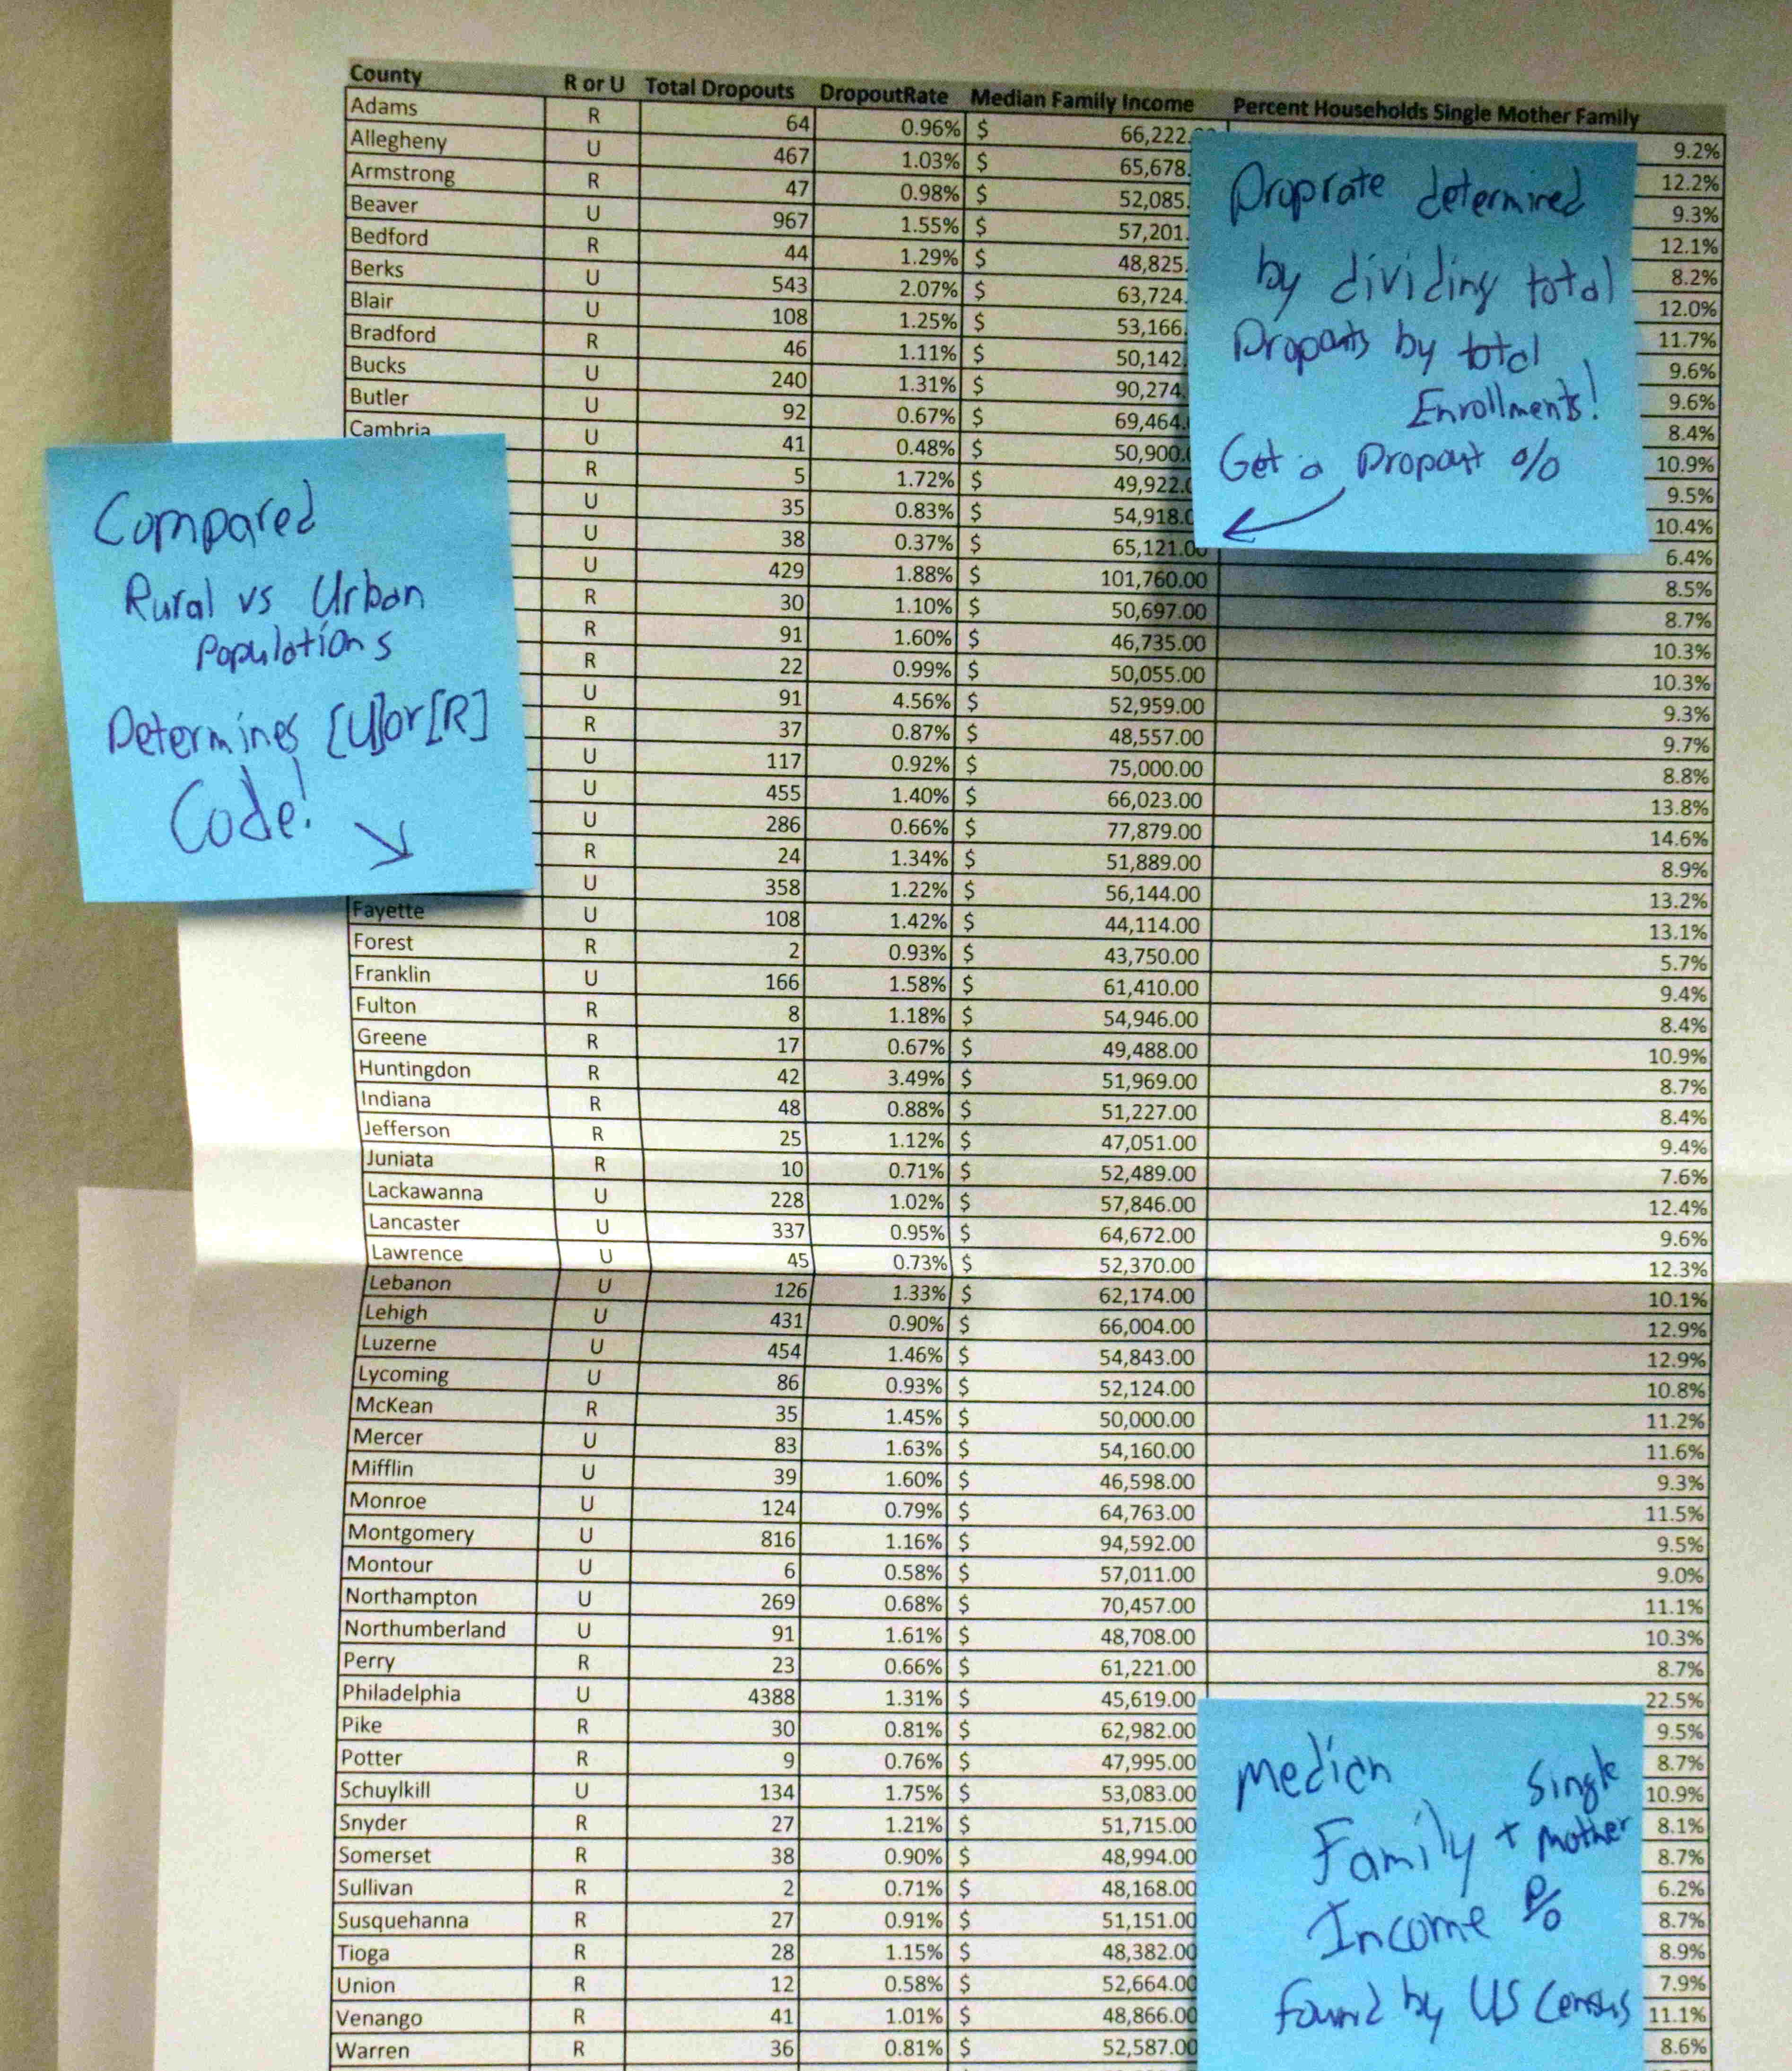
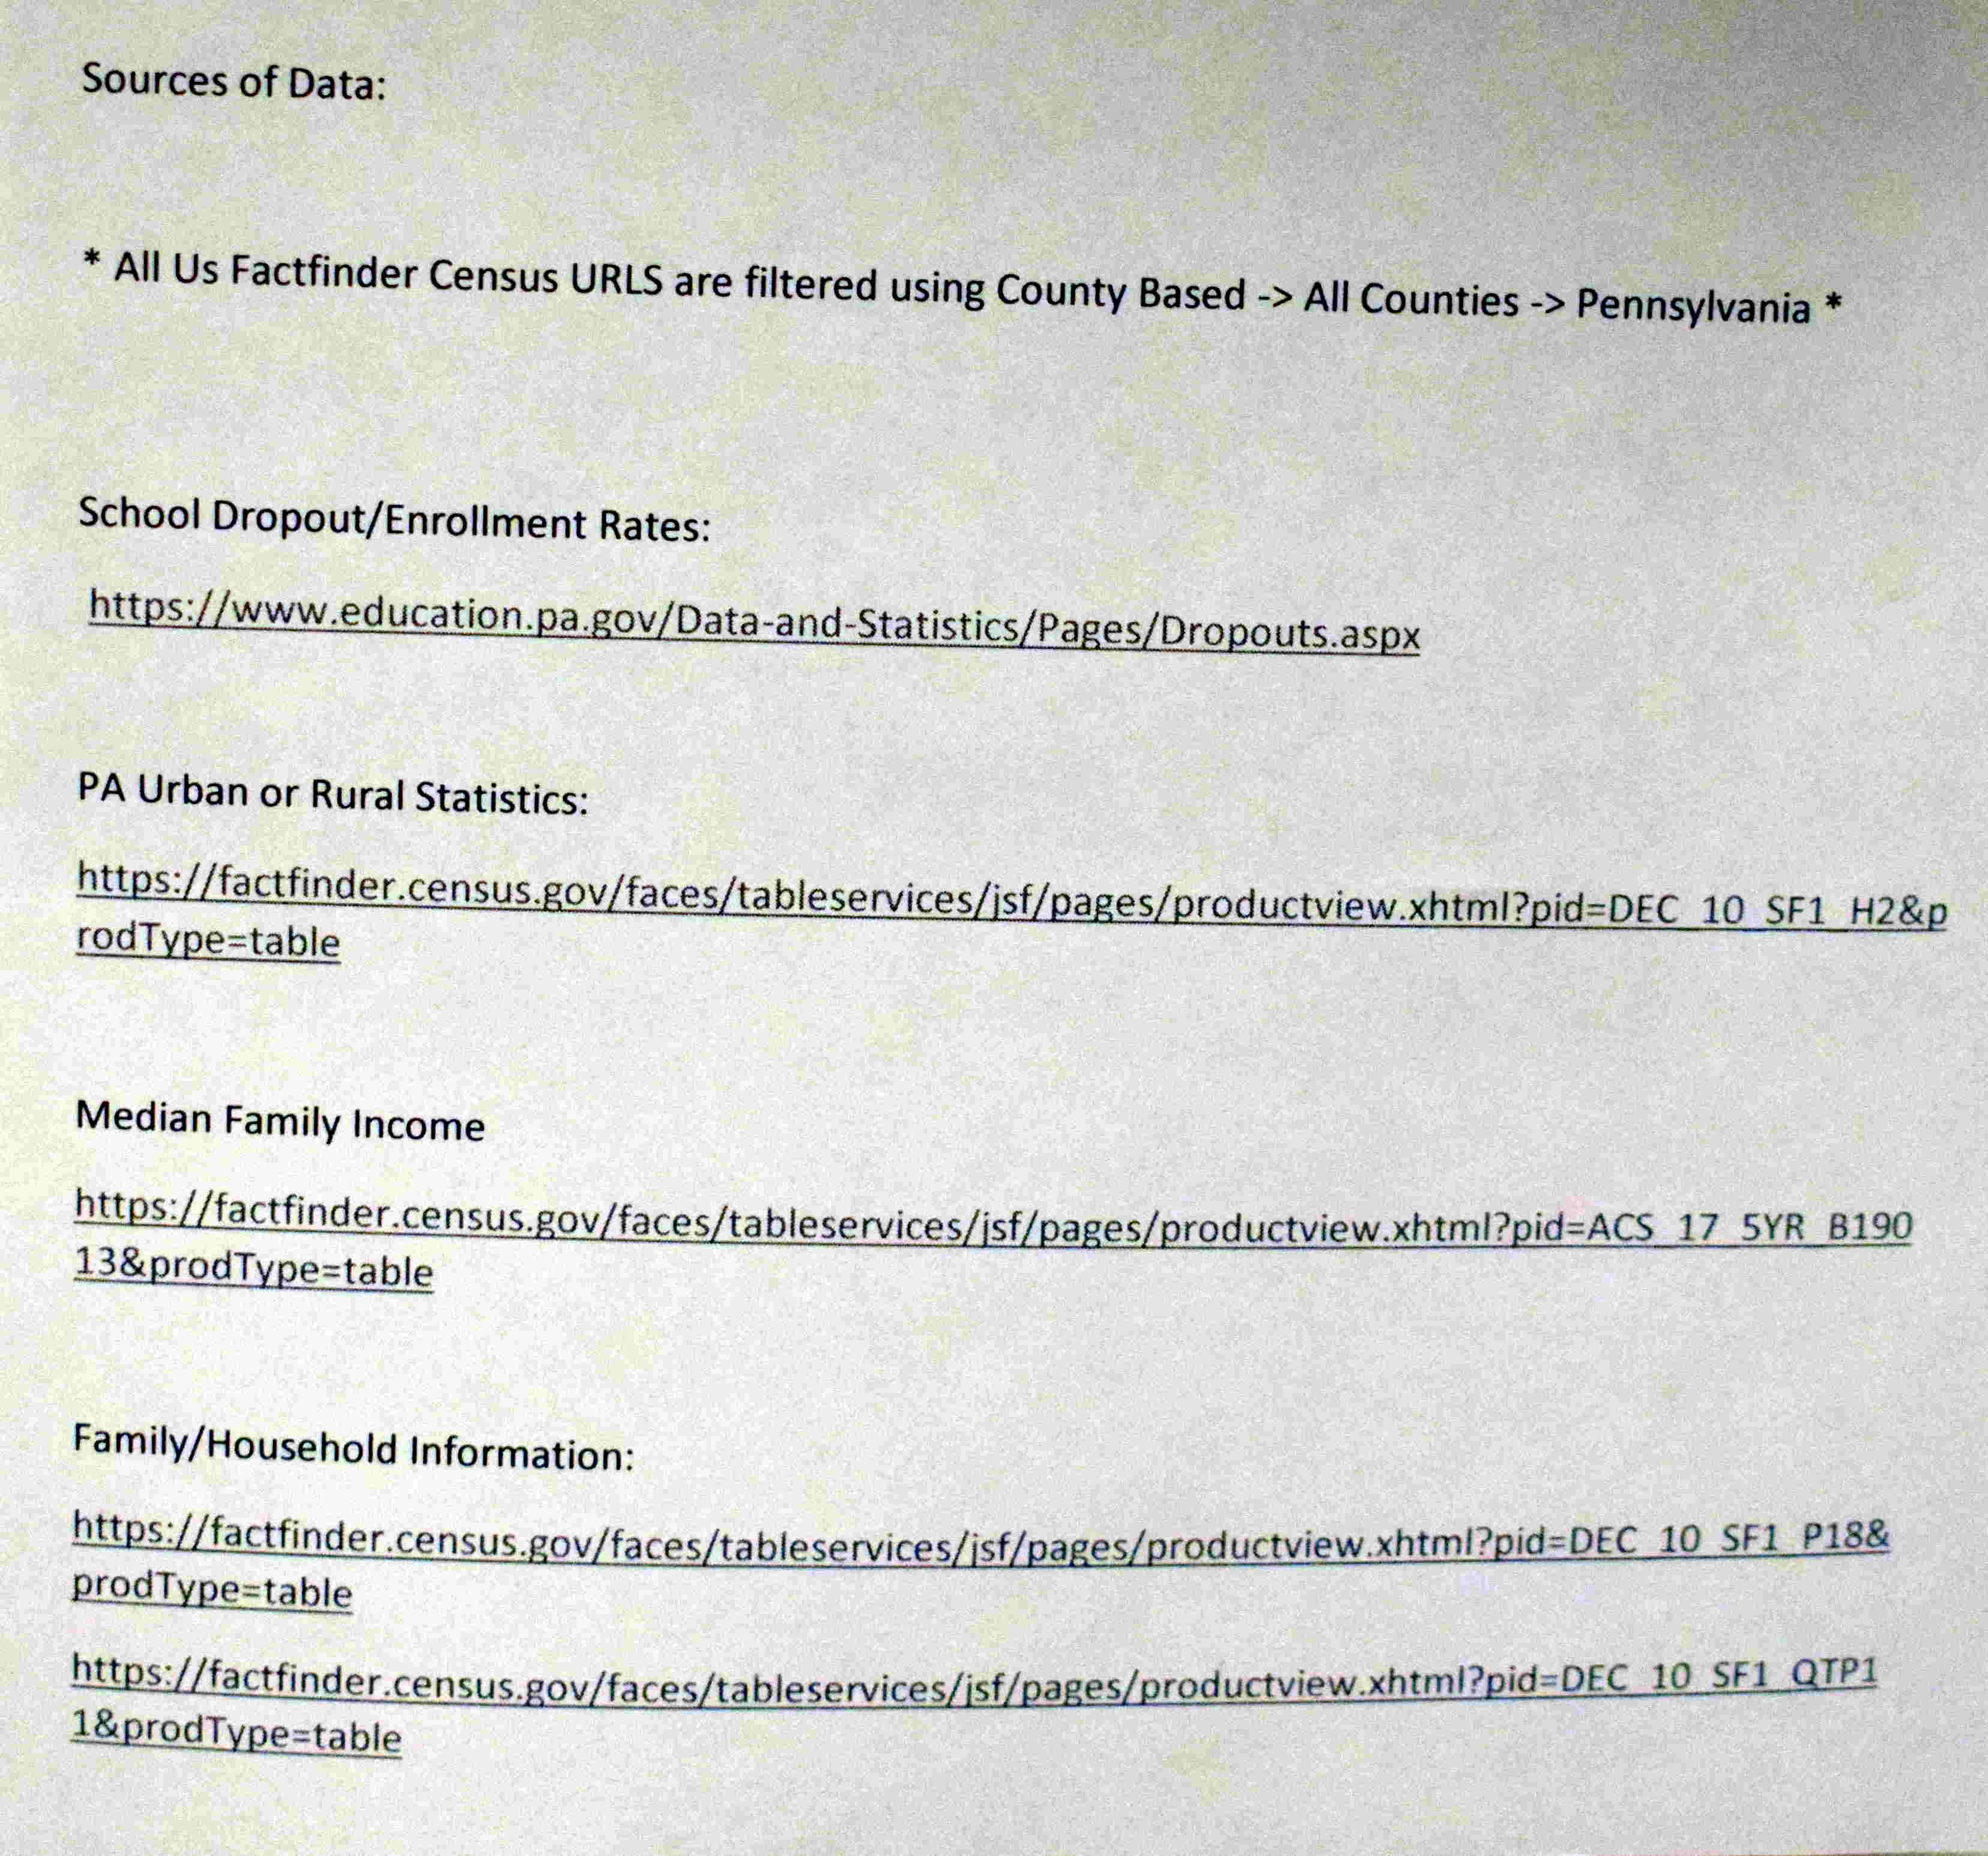
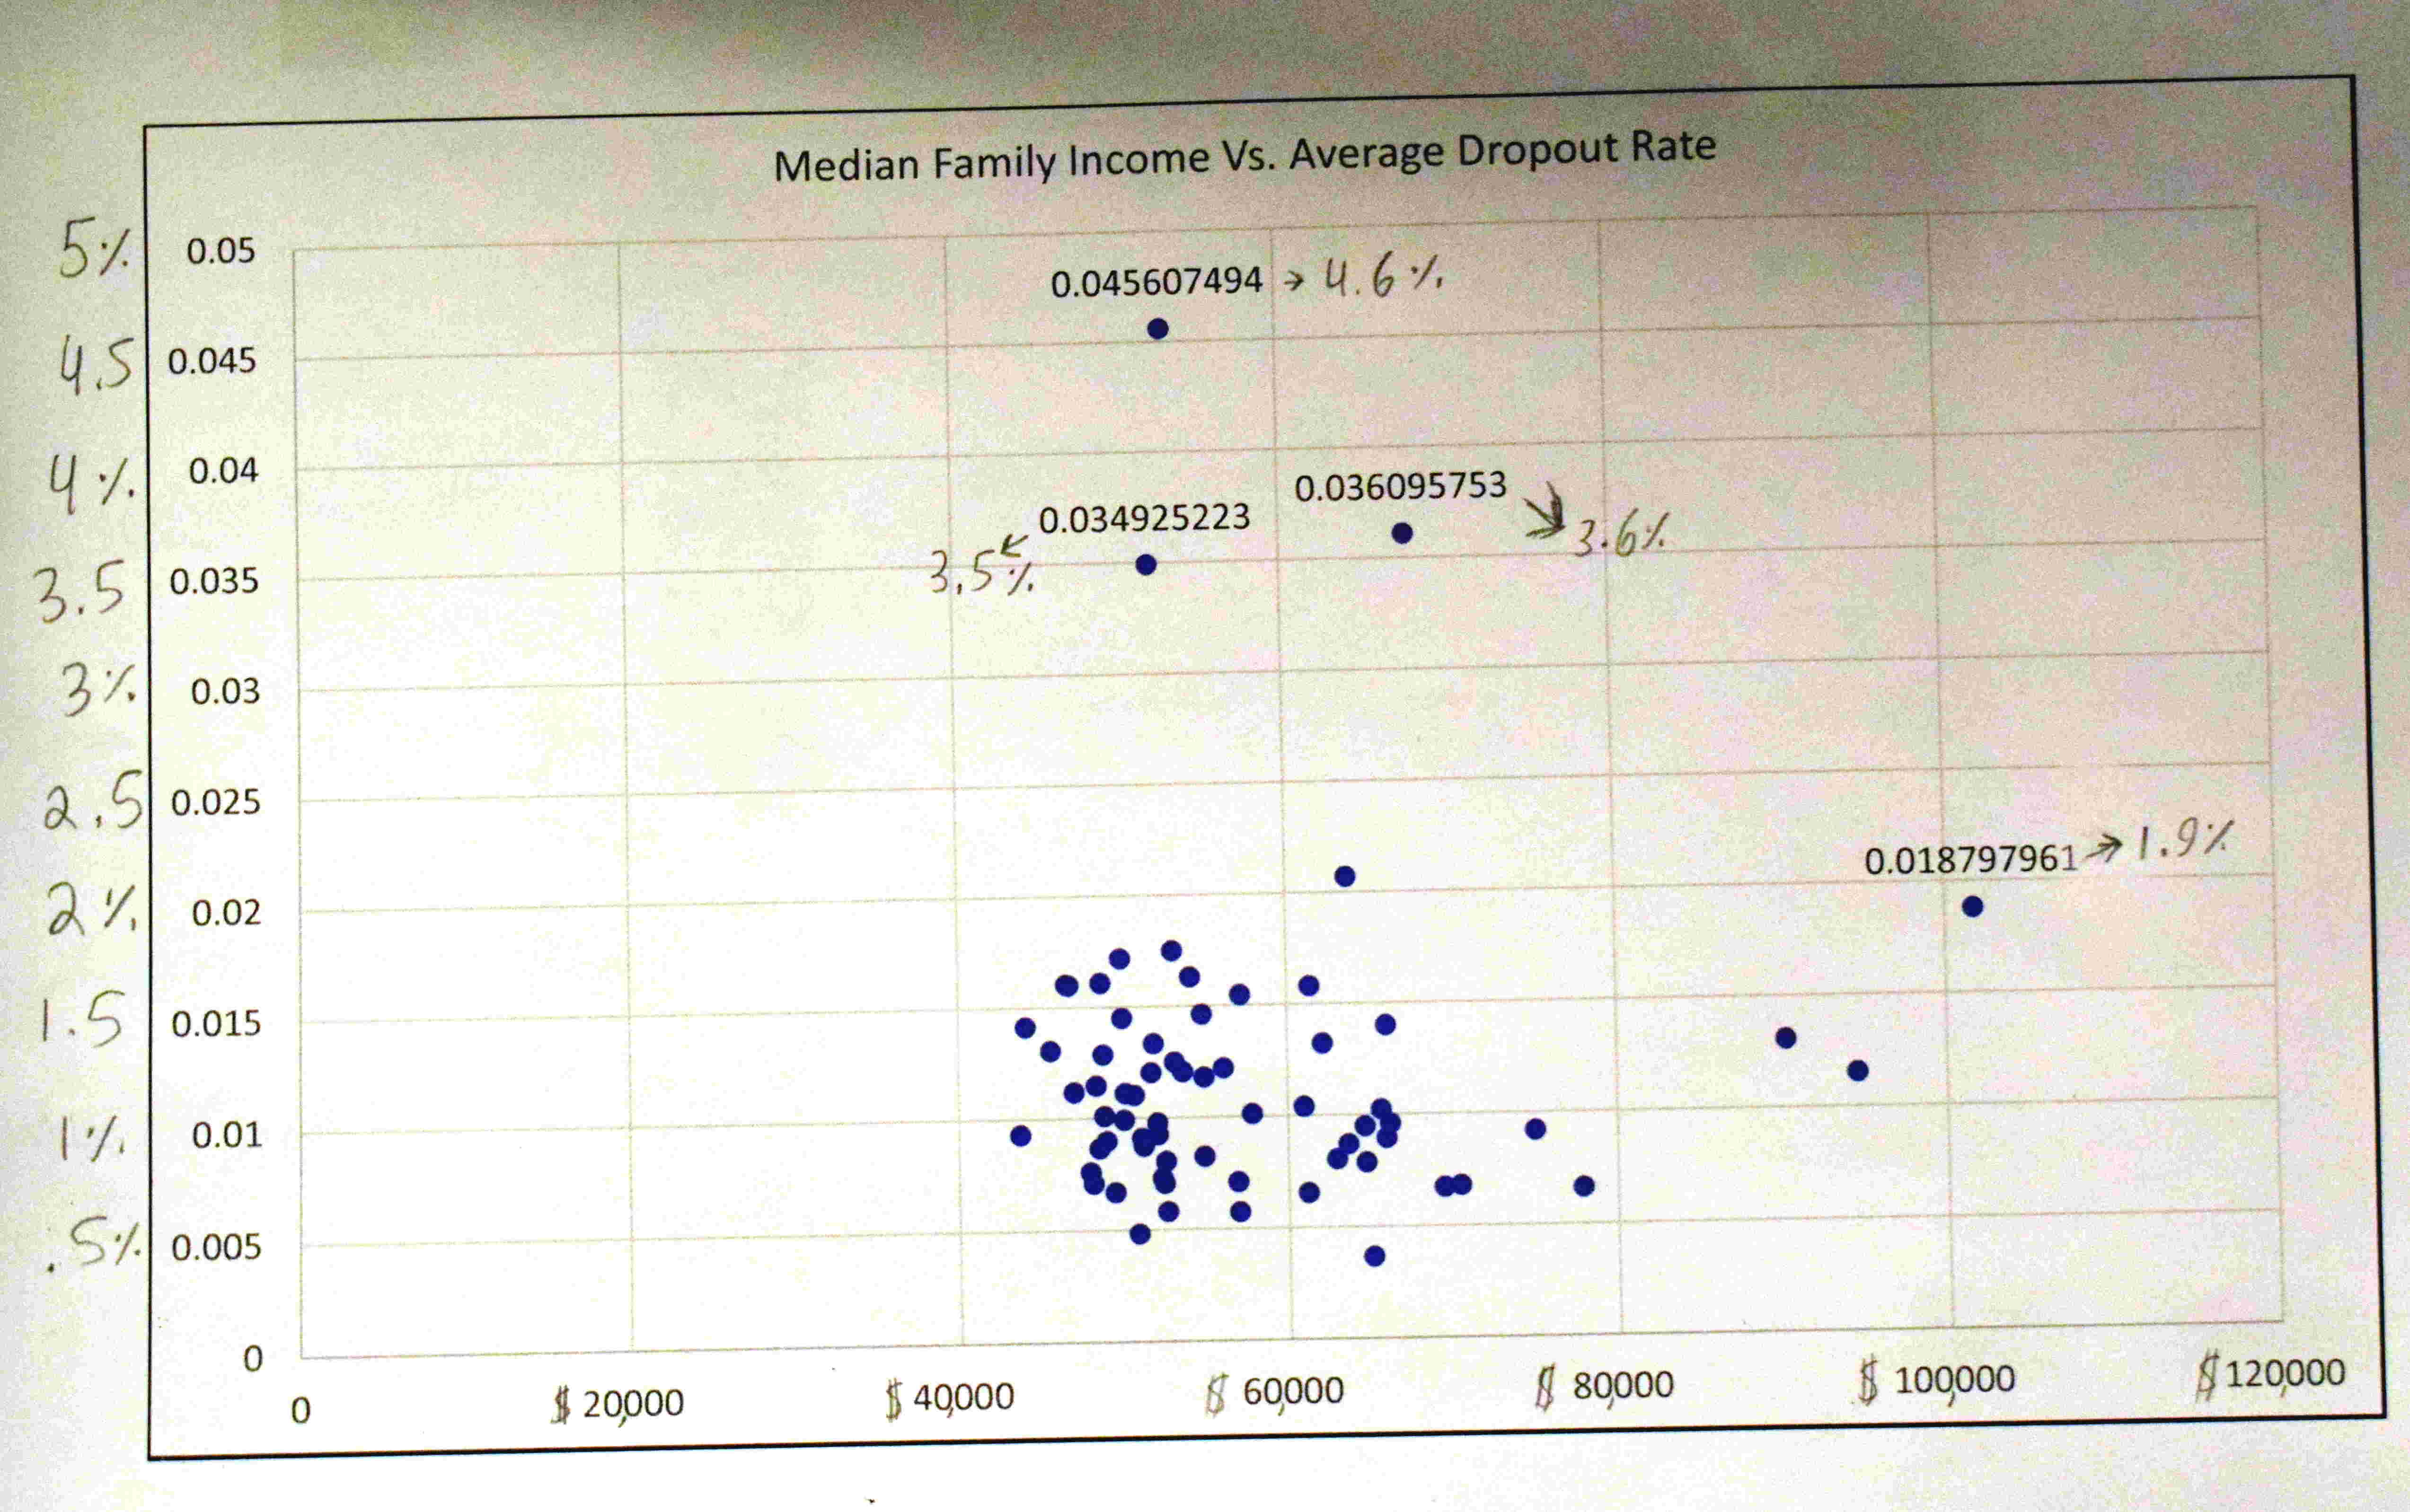
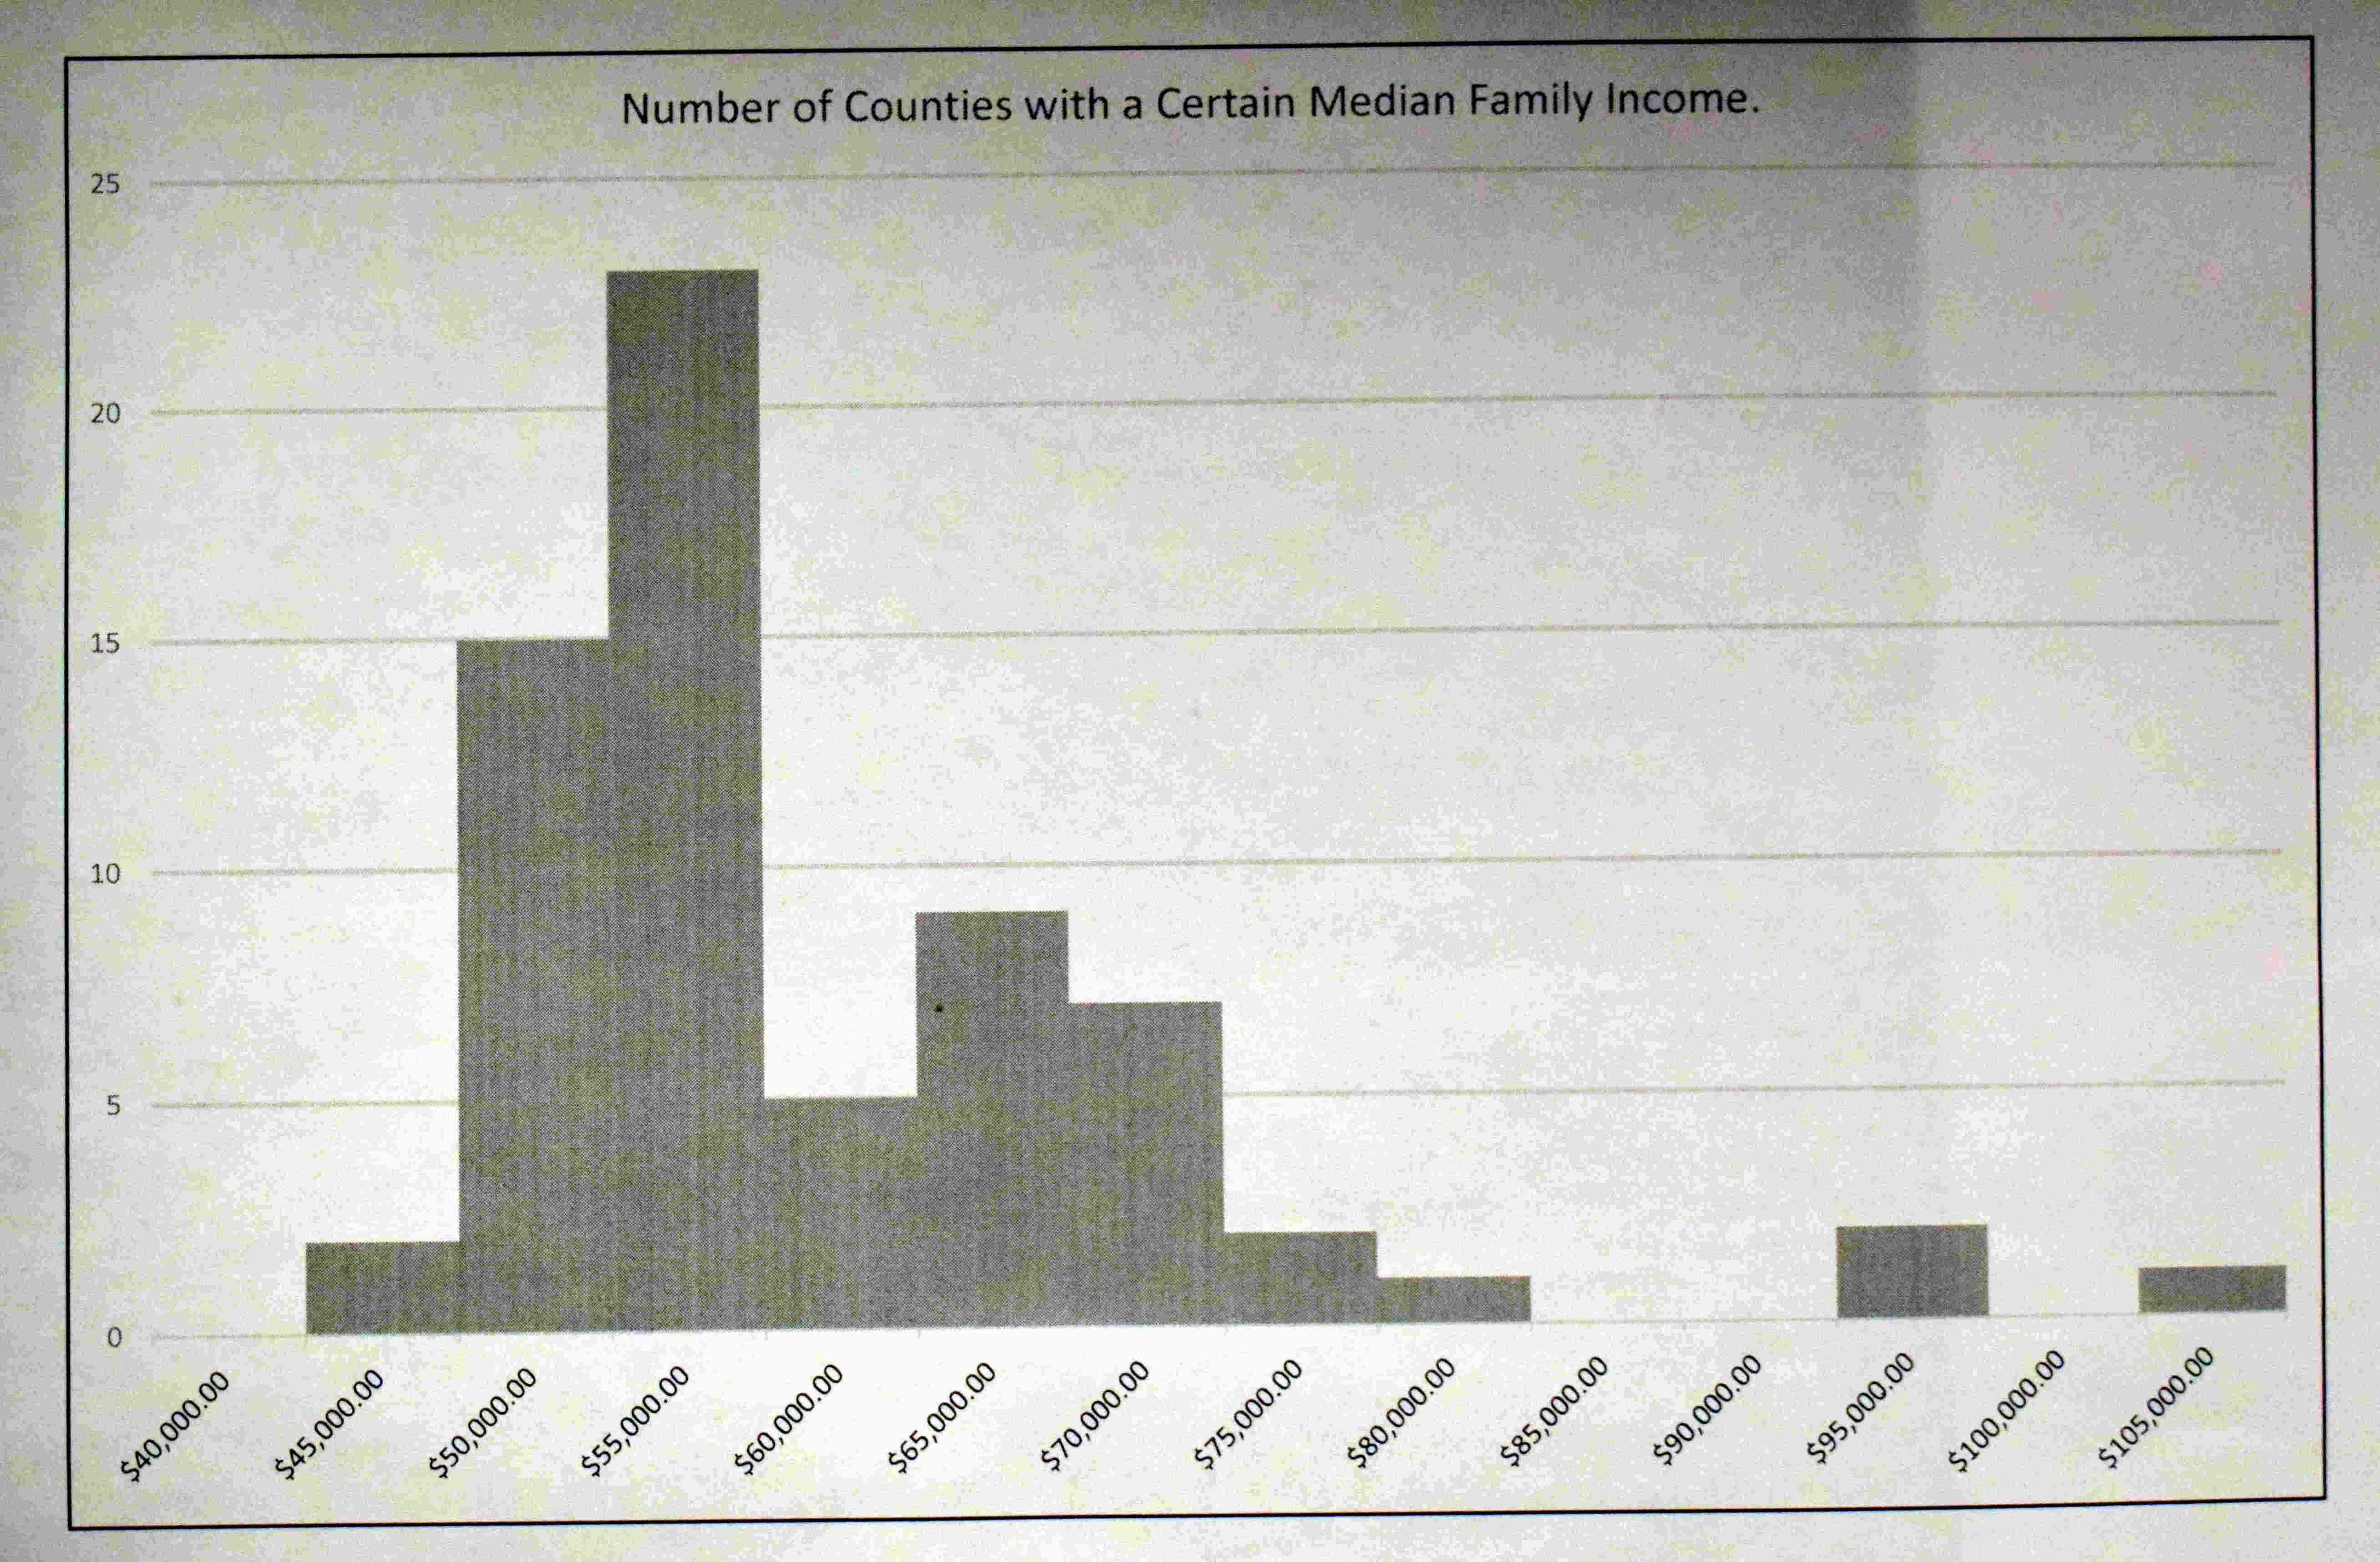
local_librarySocioeconomic status and high school dropout rates
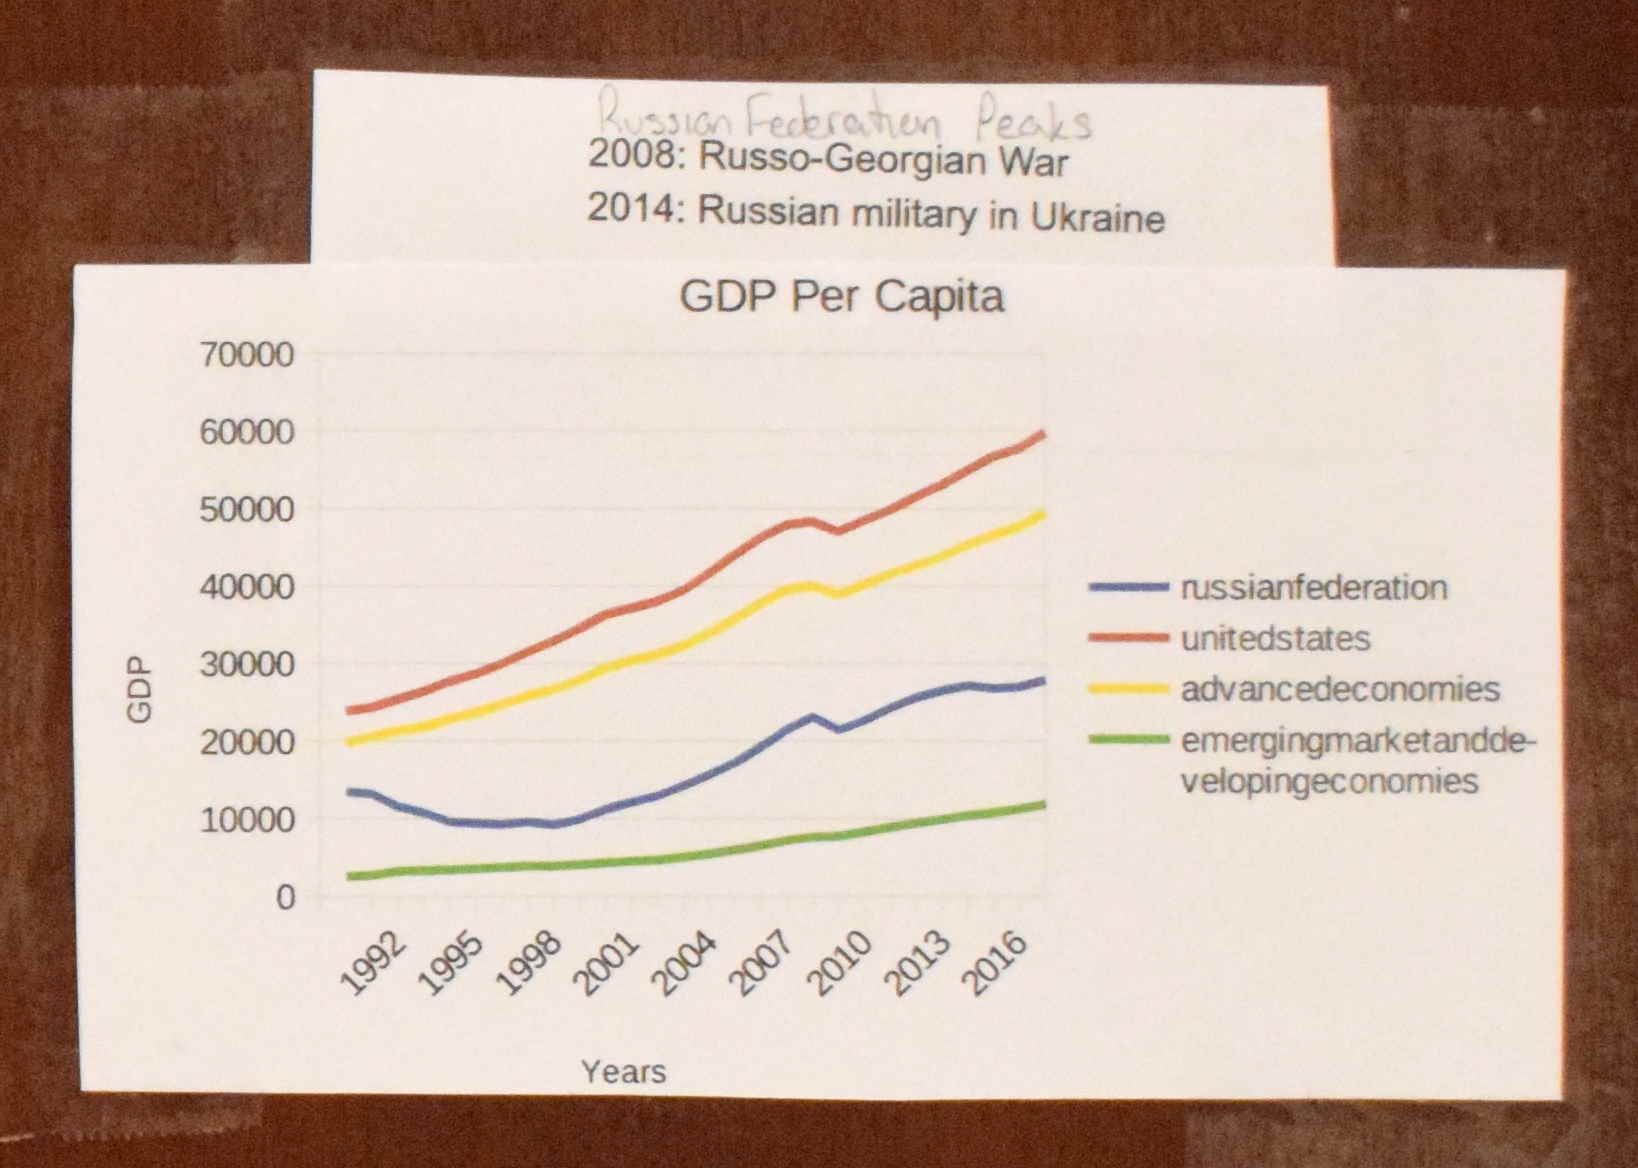
mapInternational development in Eastern Europe
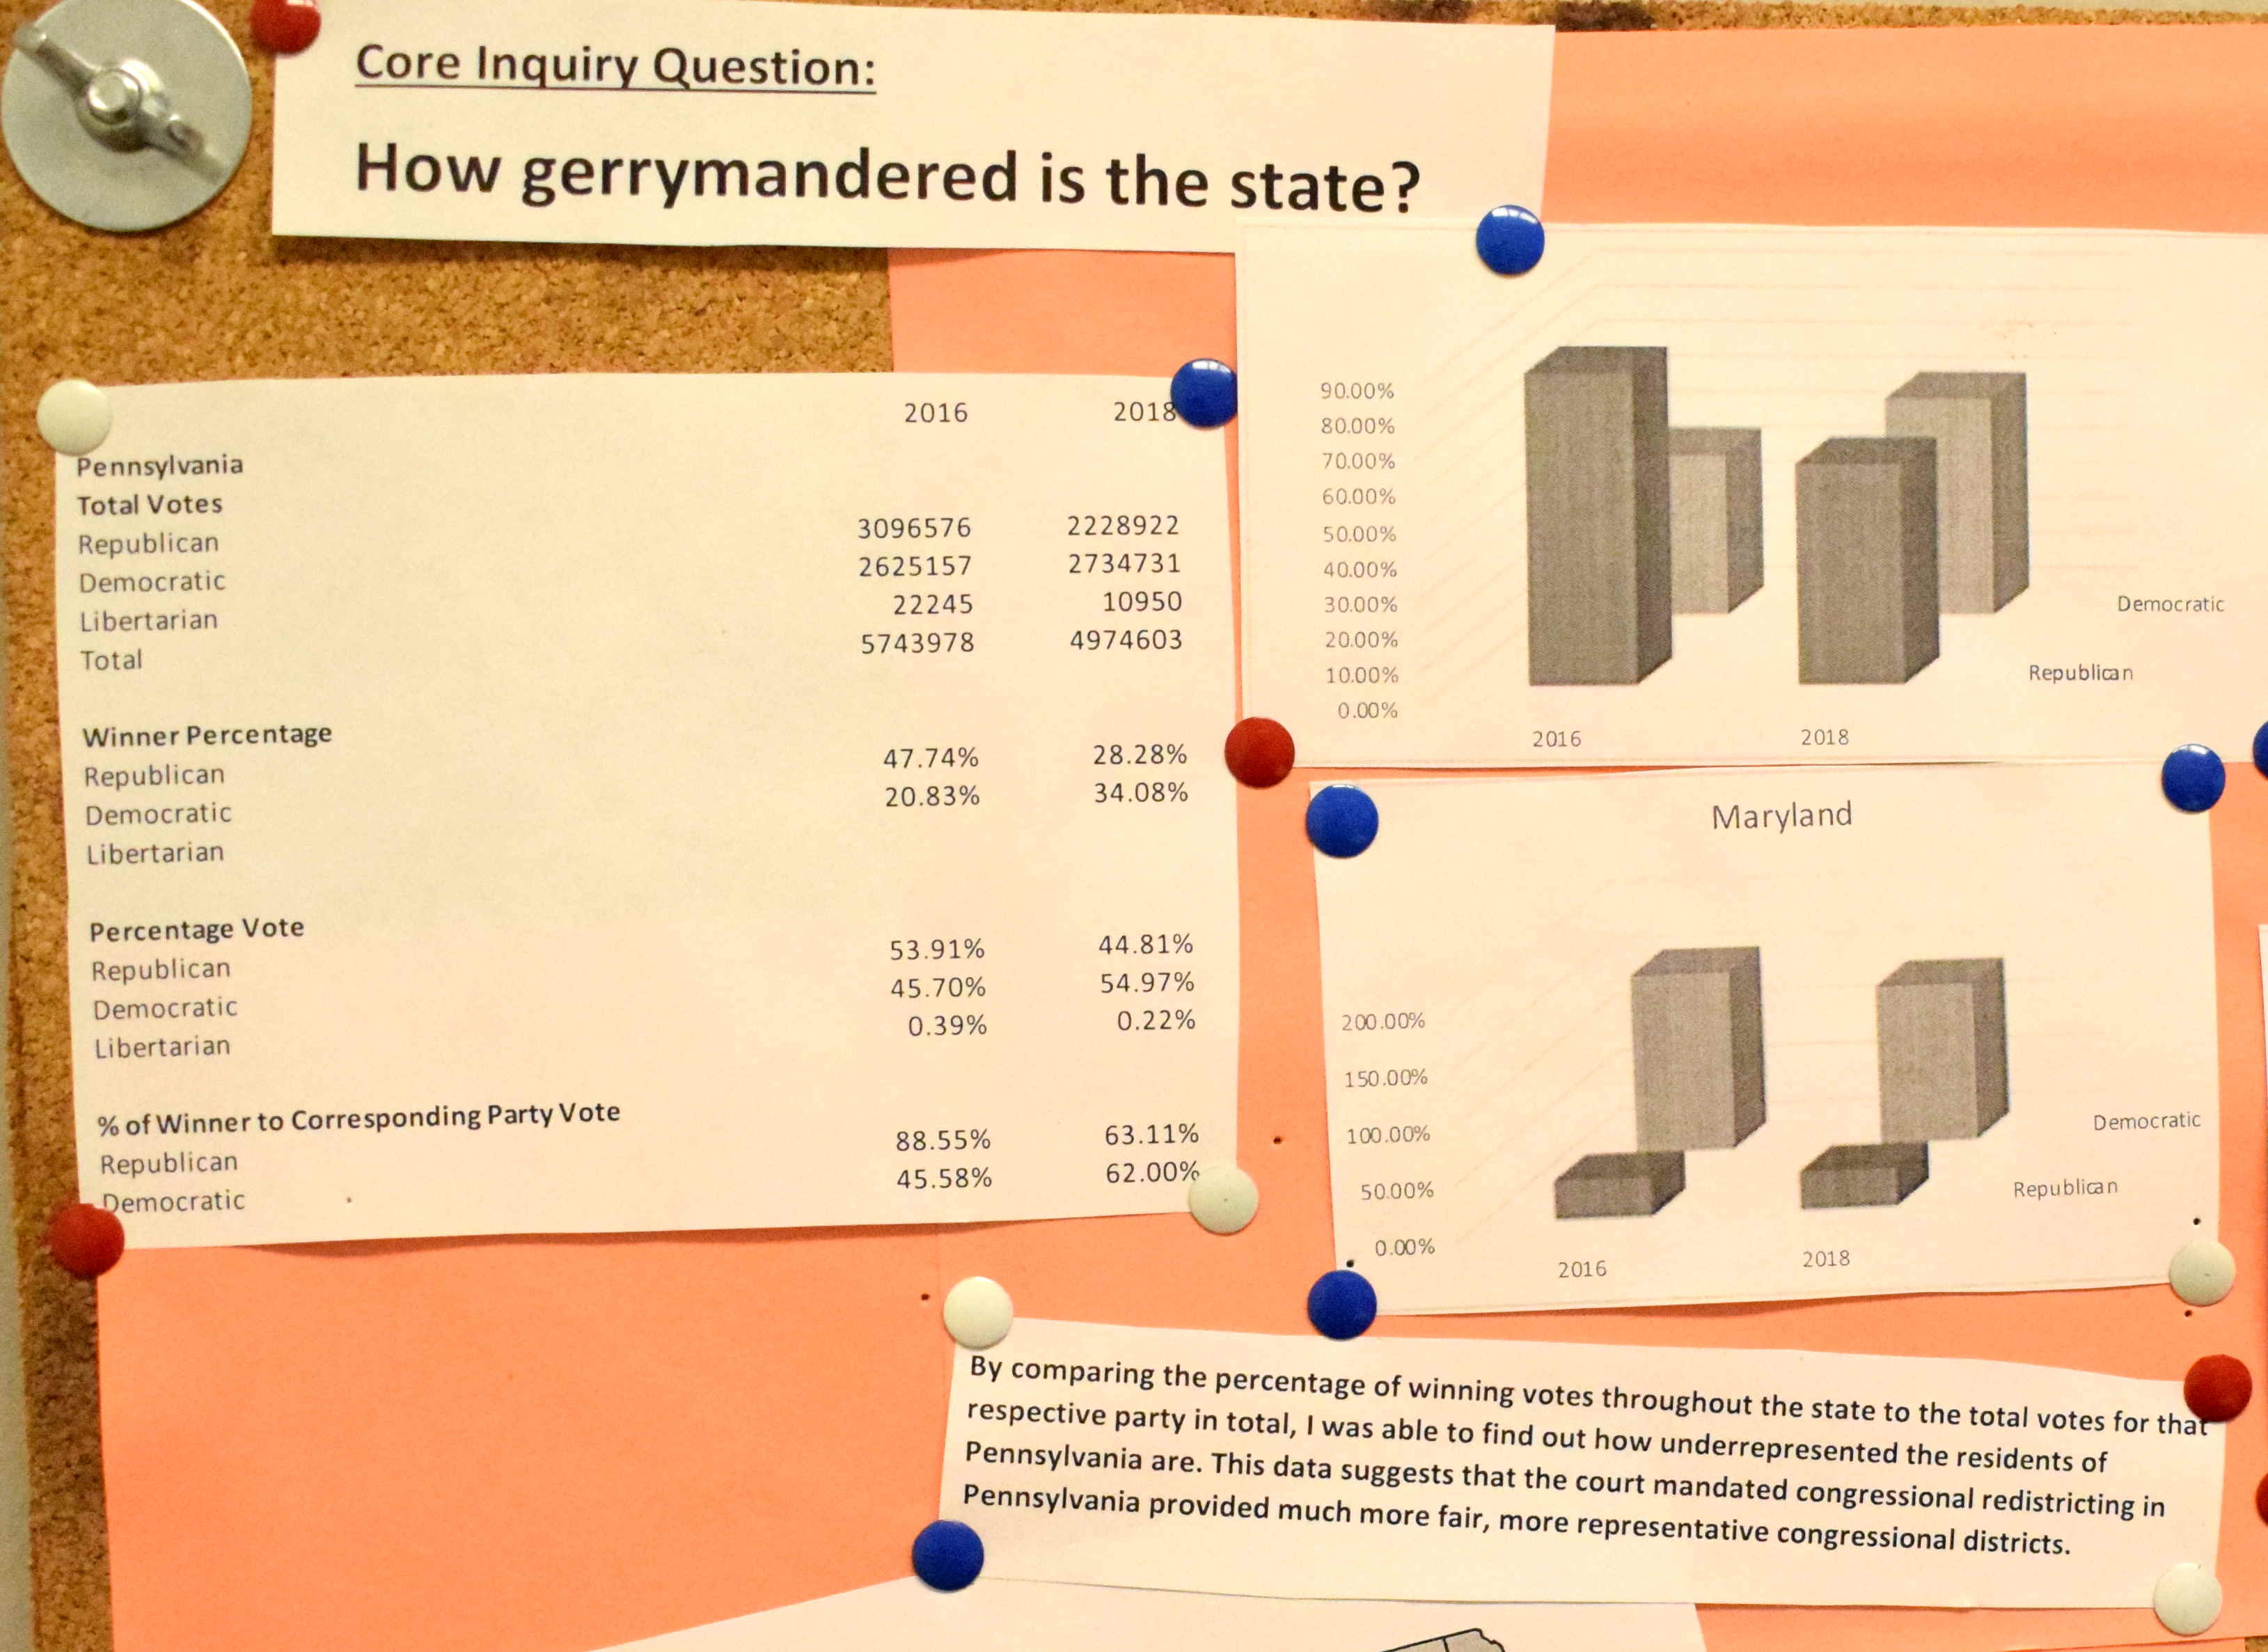
my_locationGerrymandering in PA
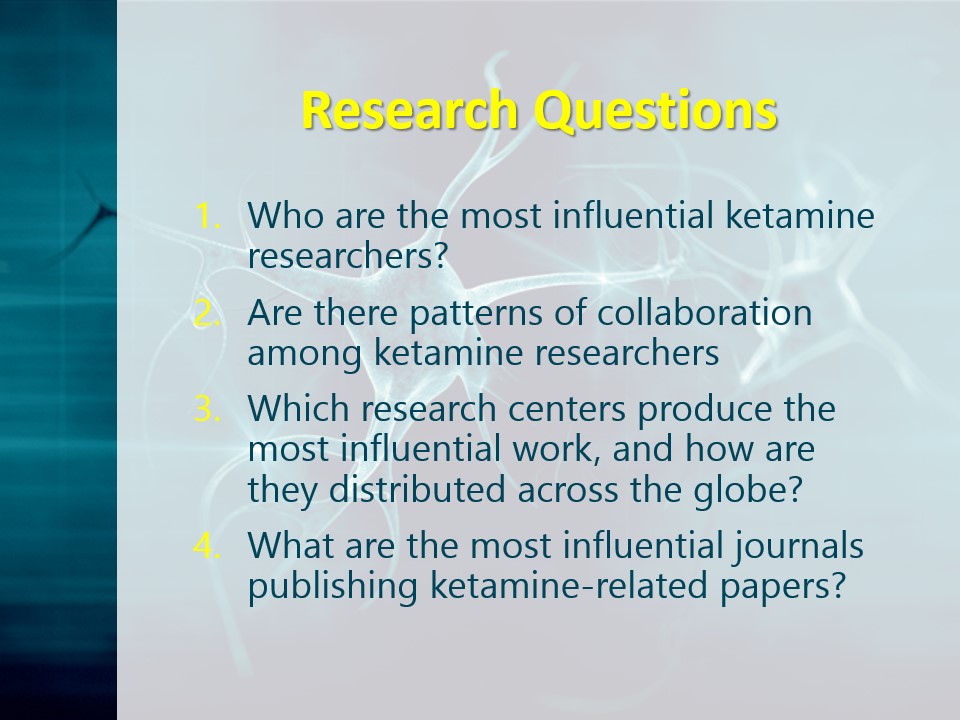
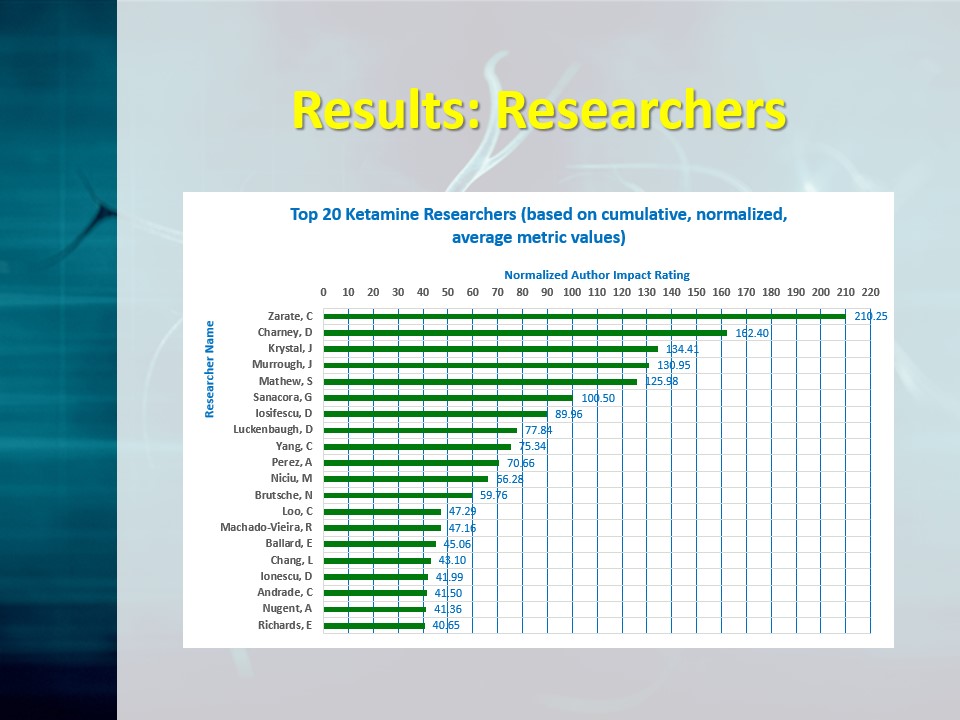
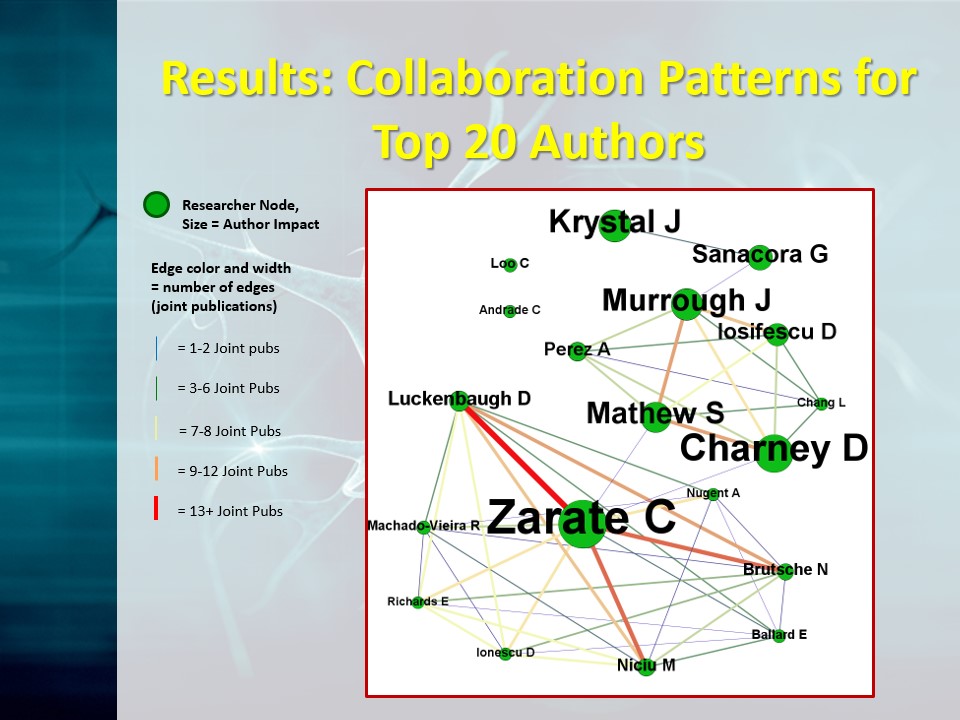
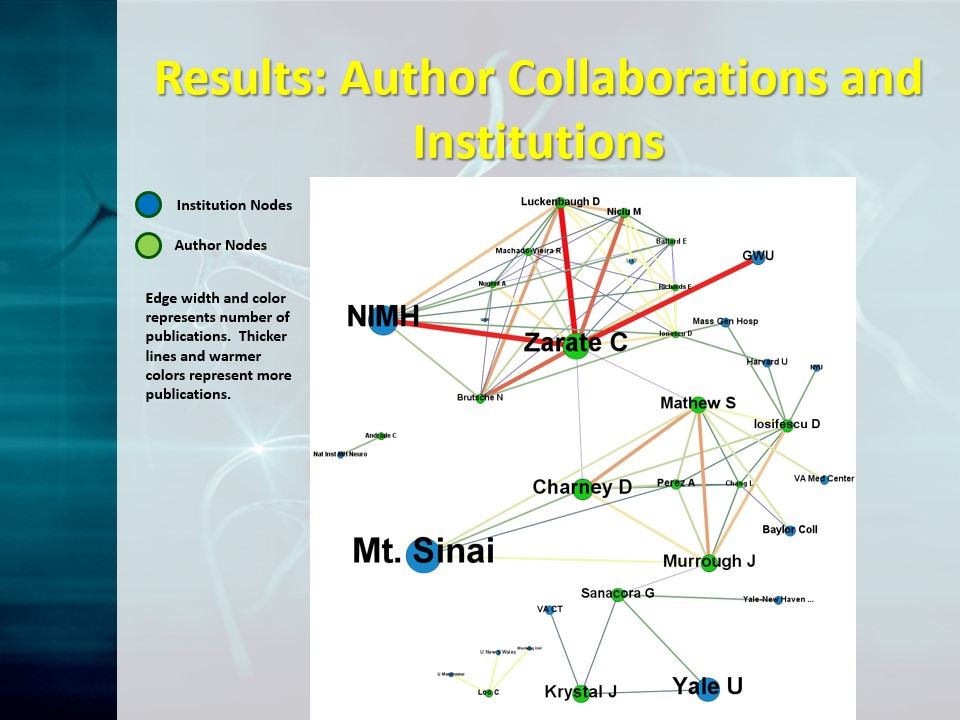
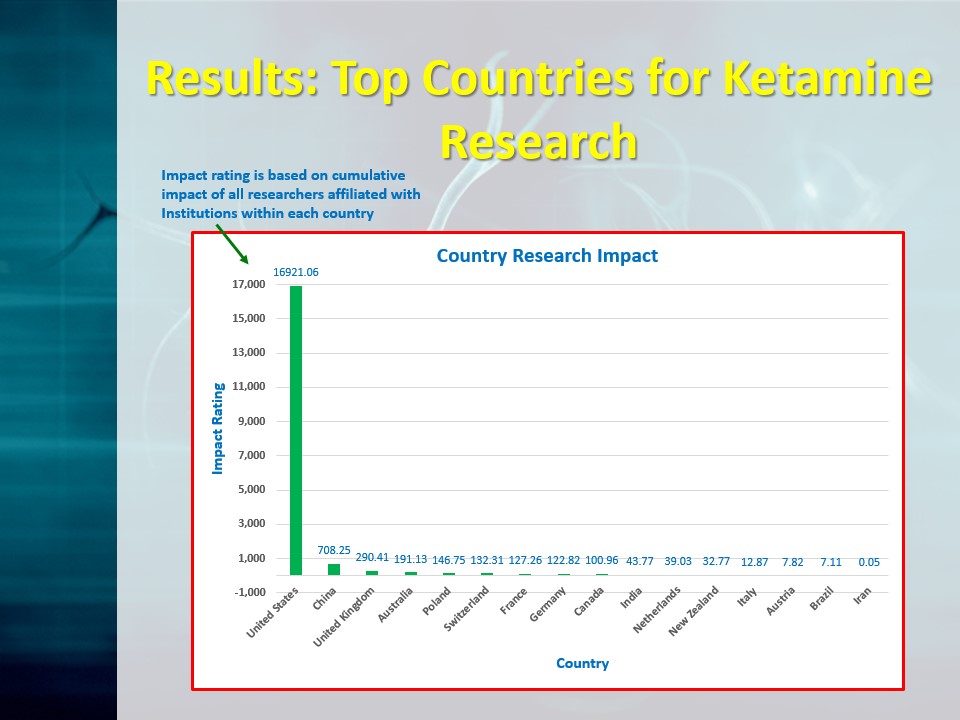
local_hospitalVisualizing peer-reviewed Ketamine research graph data
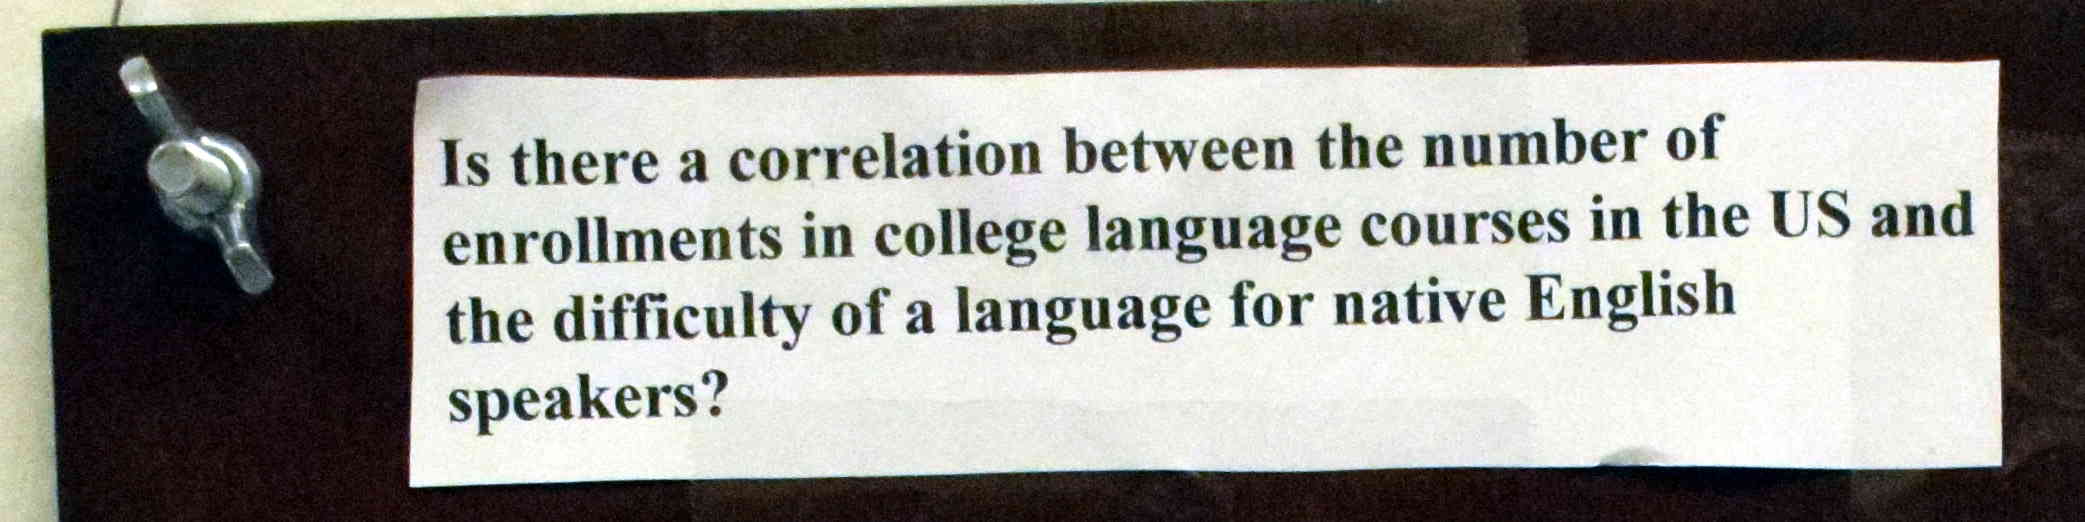
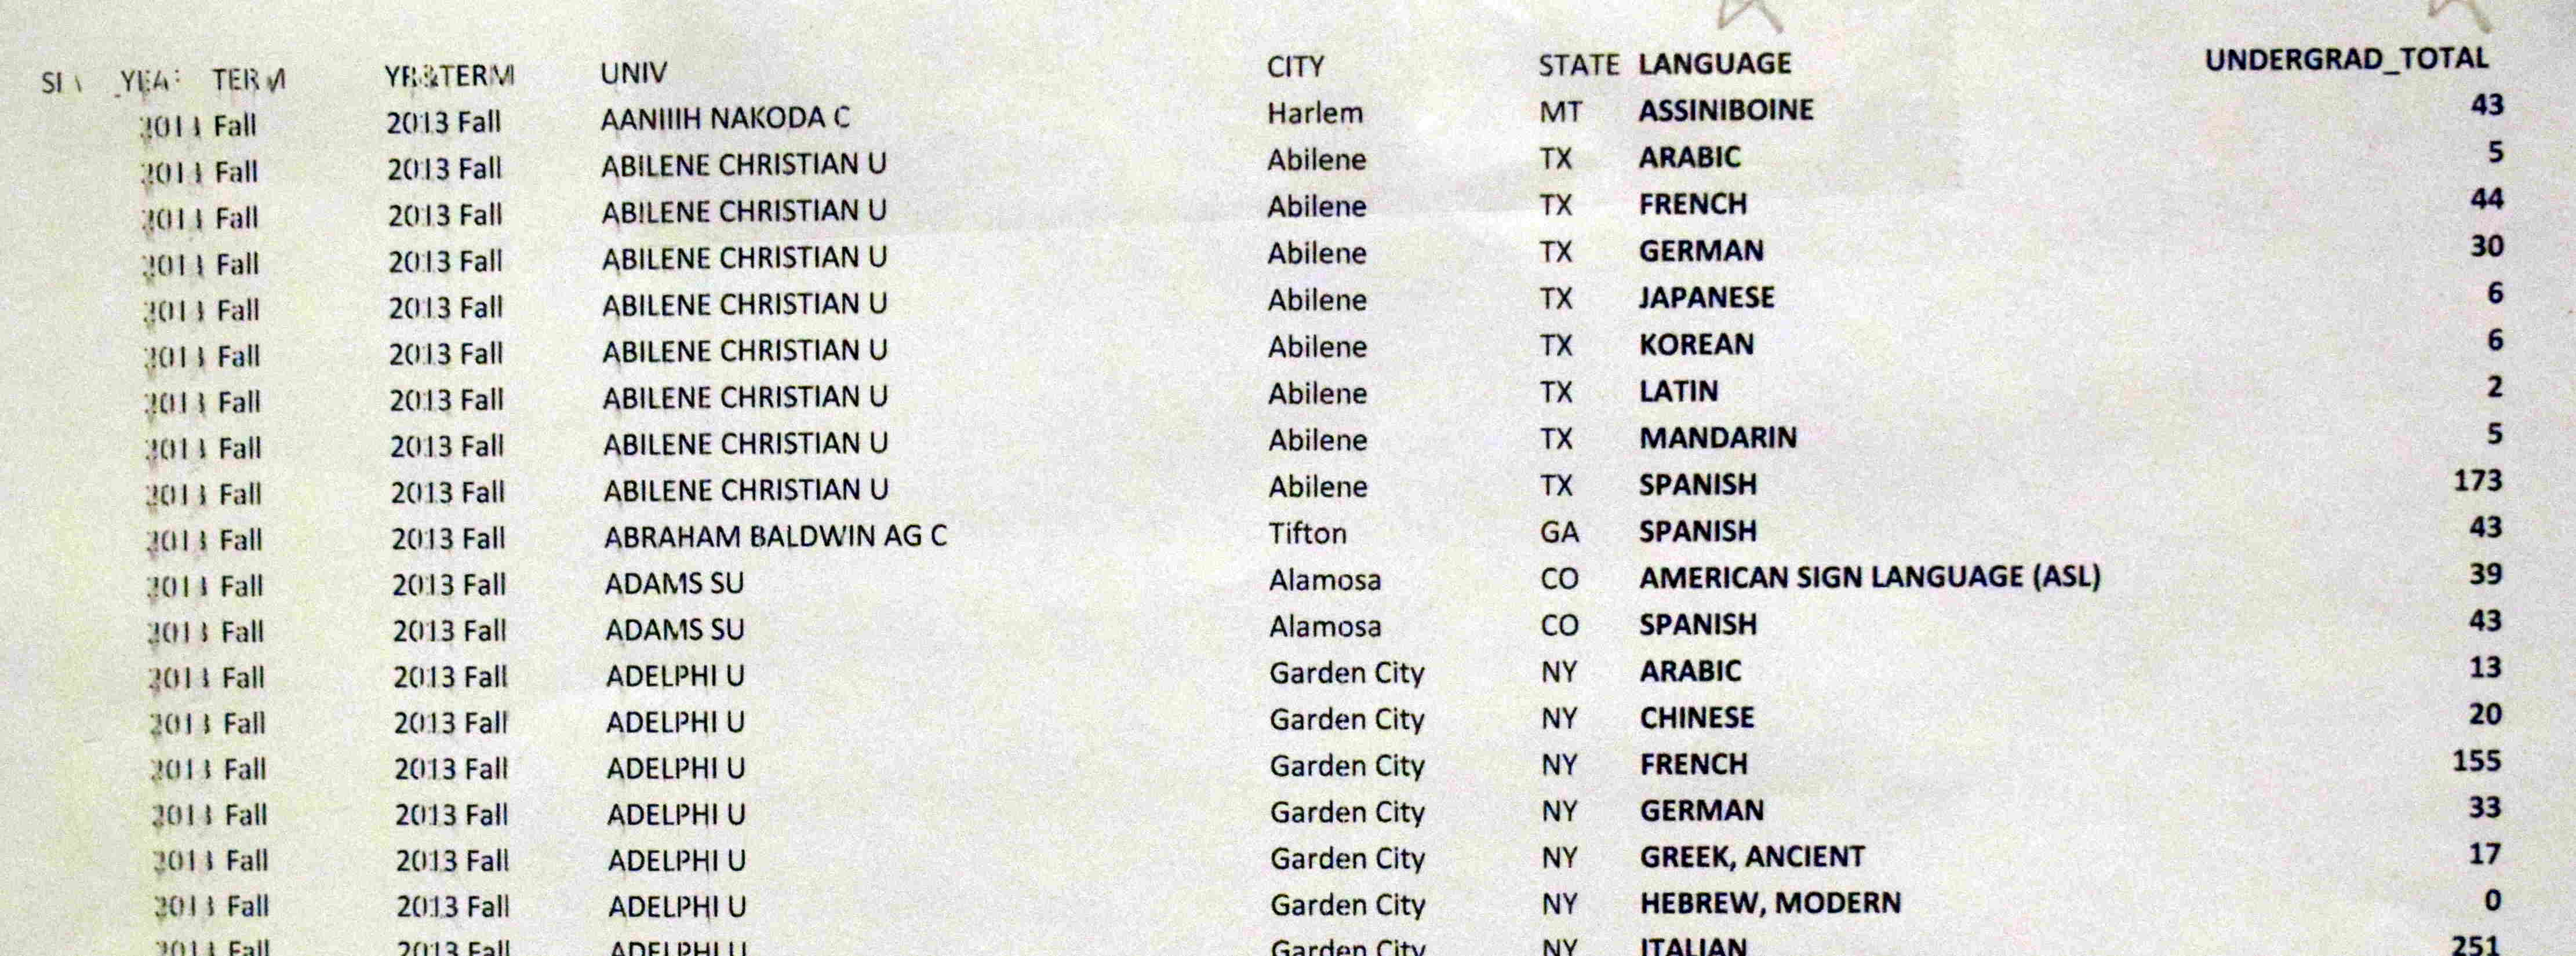
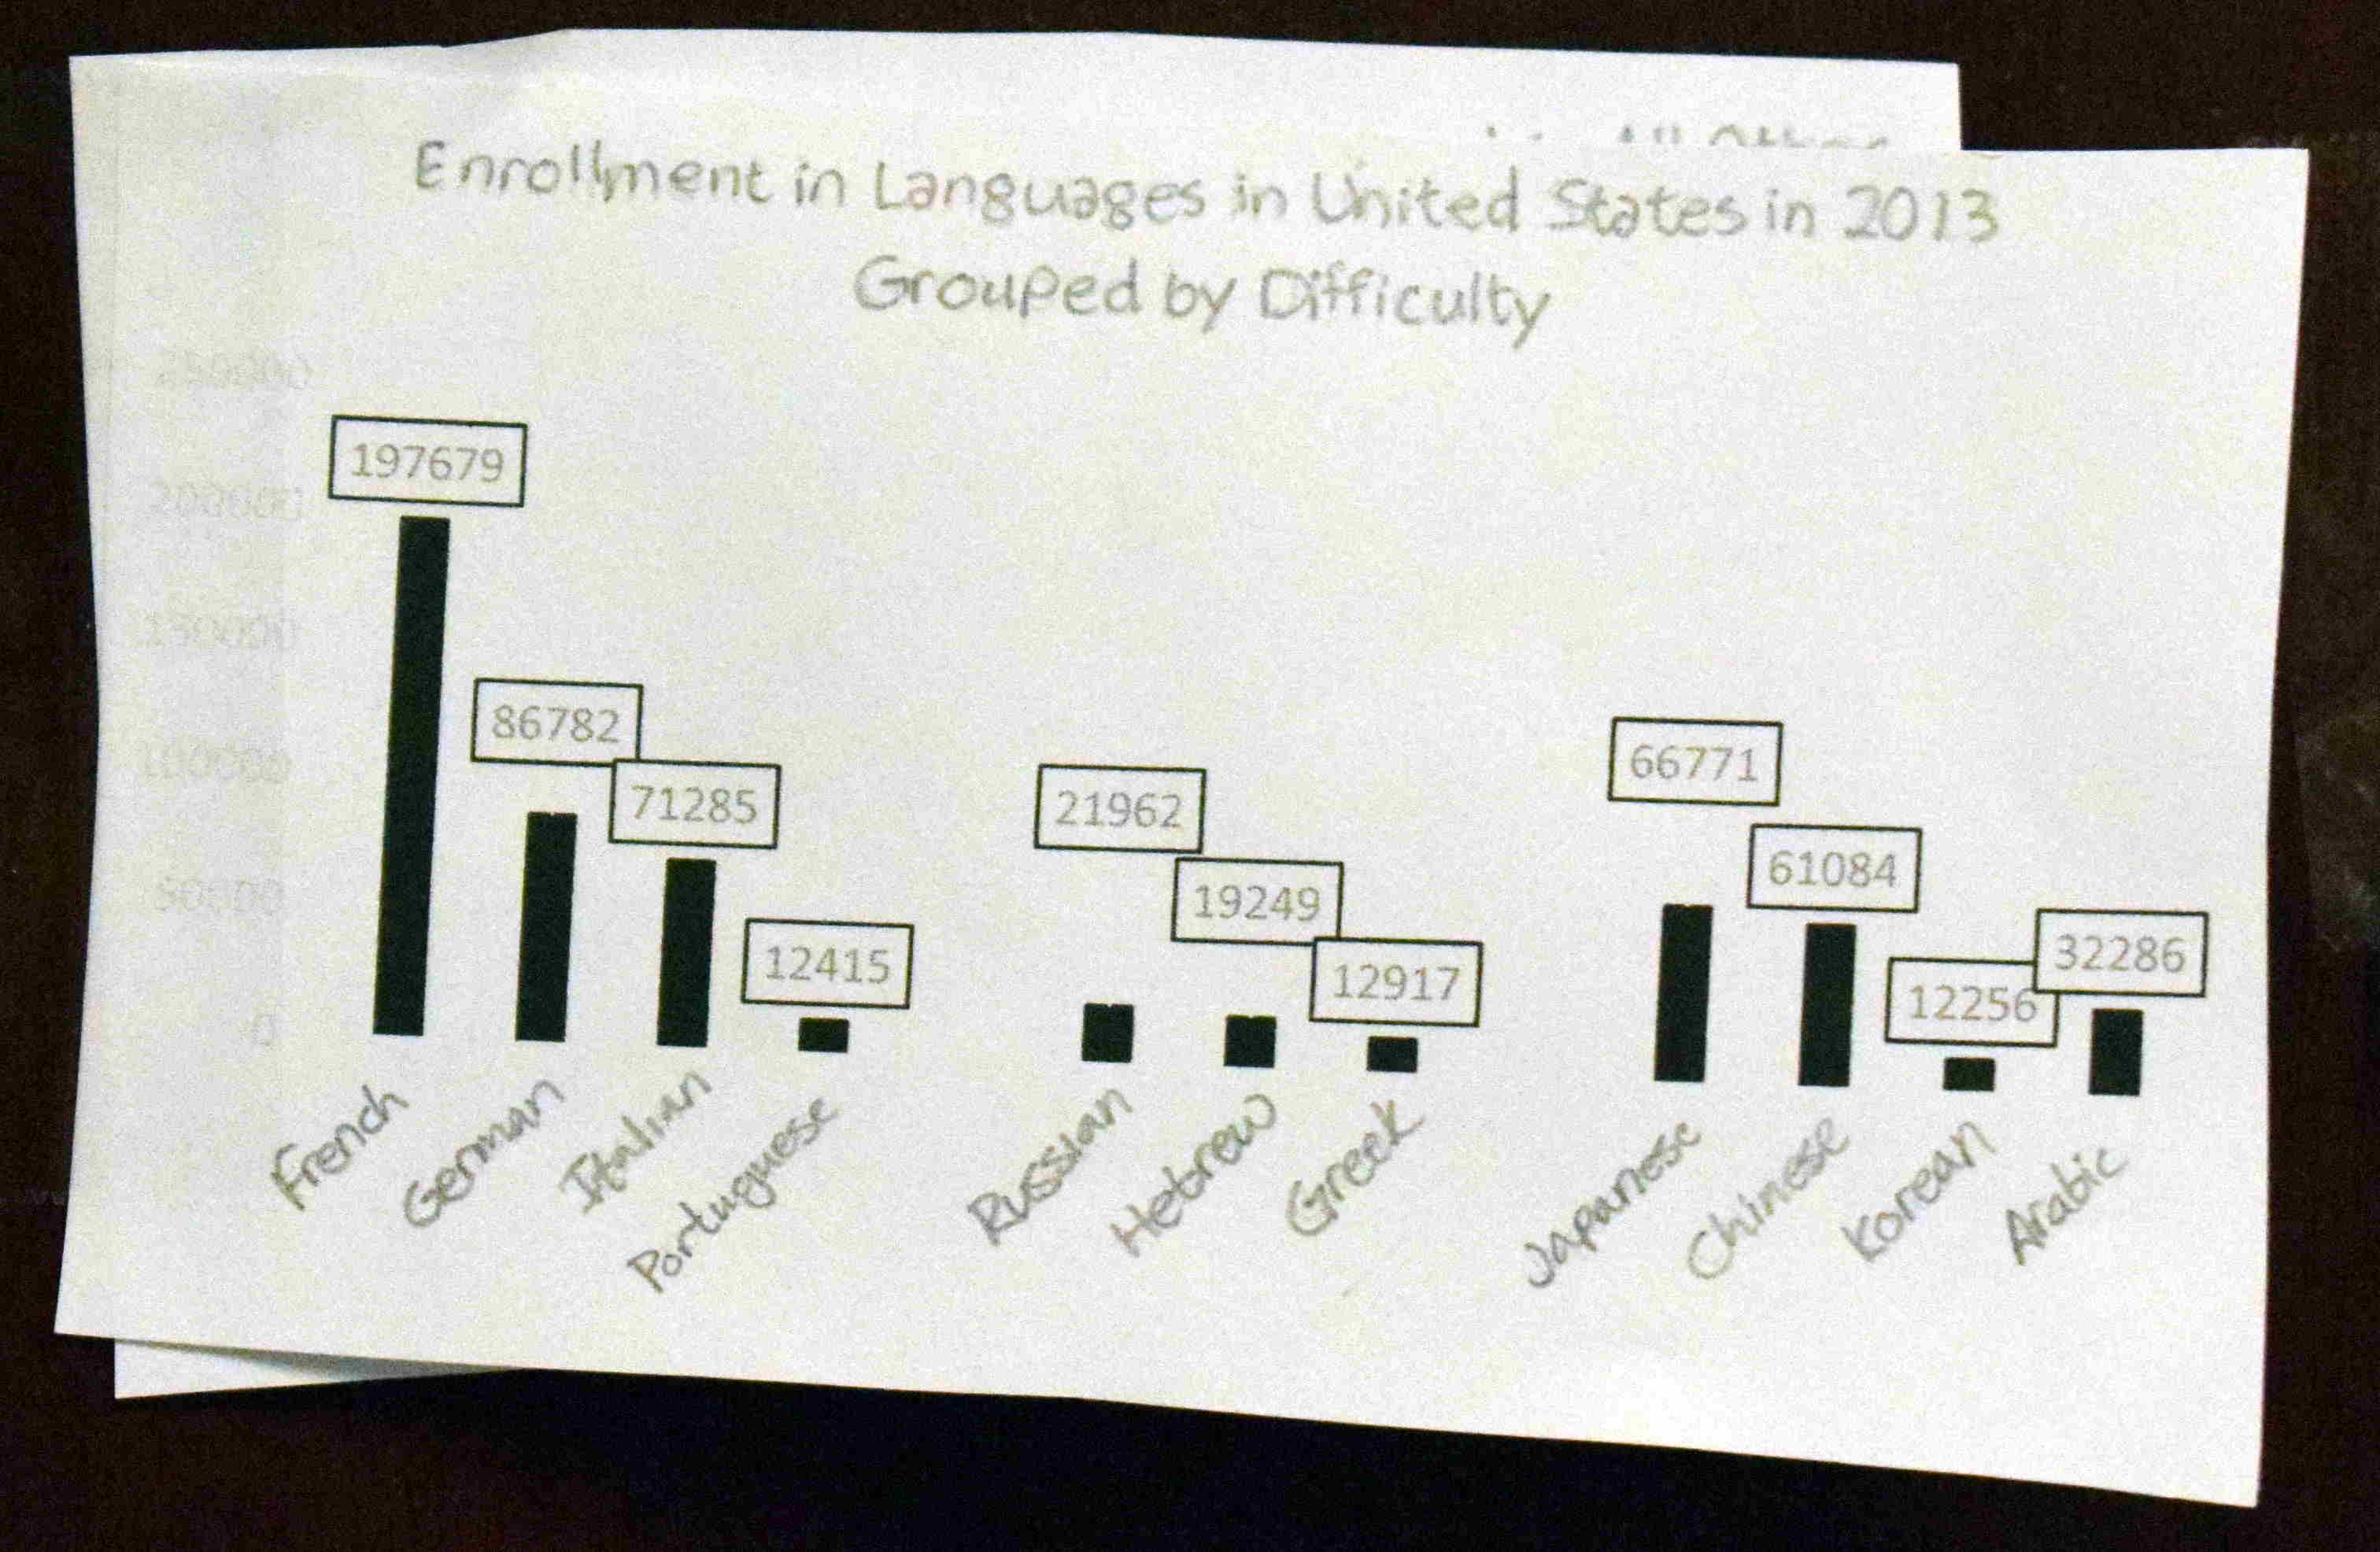
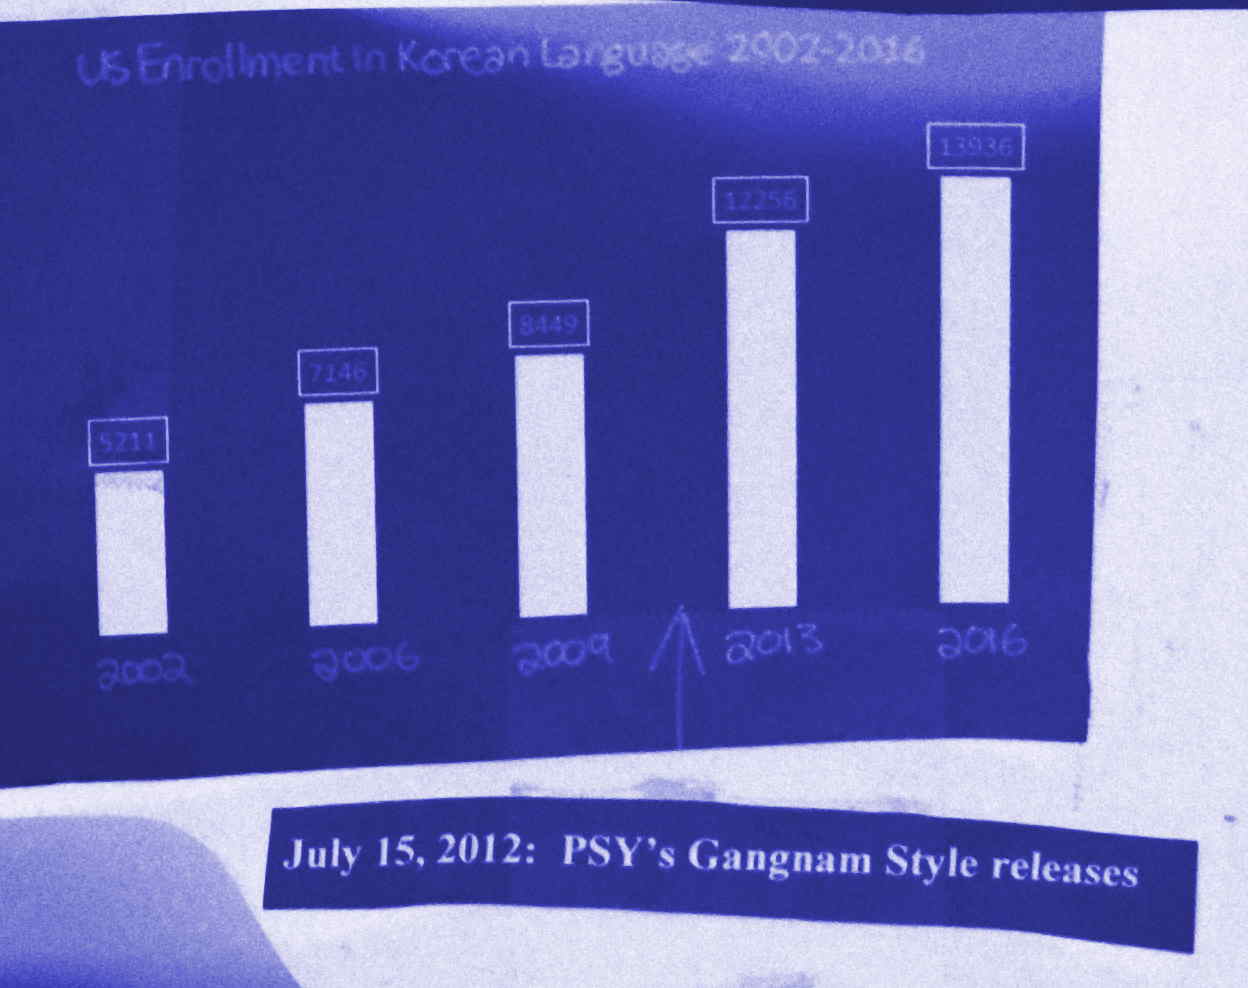
languageCorrelating foreign language enrollment and difficulty levels
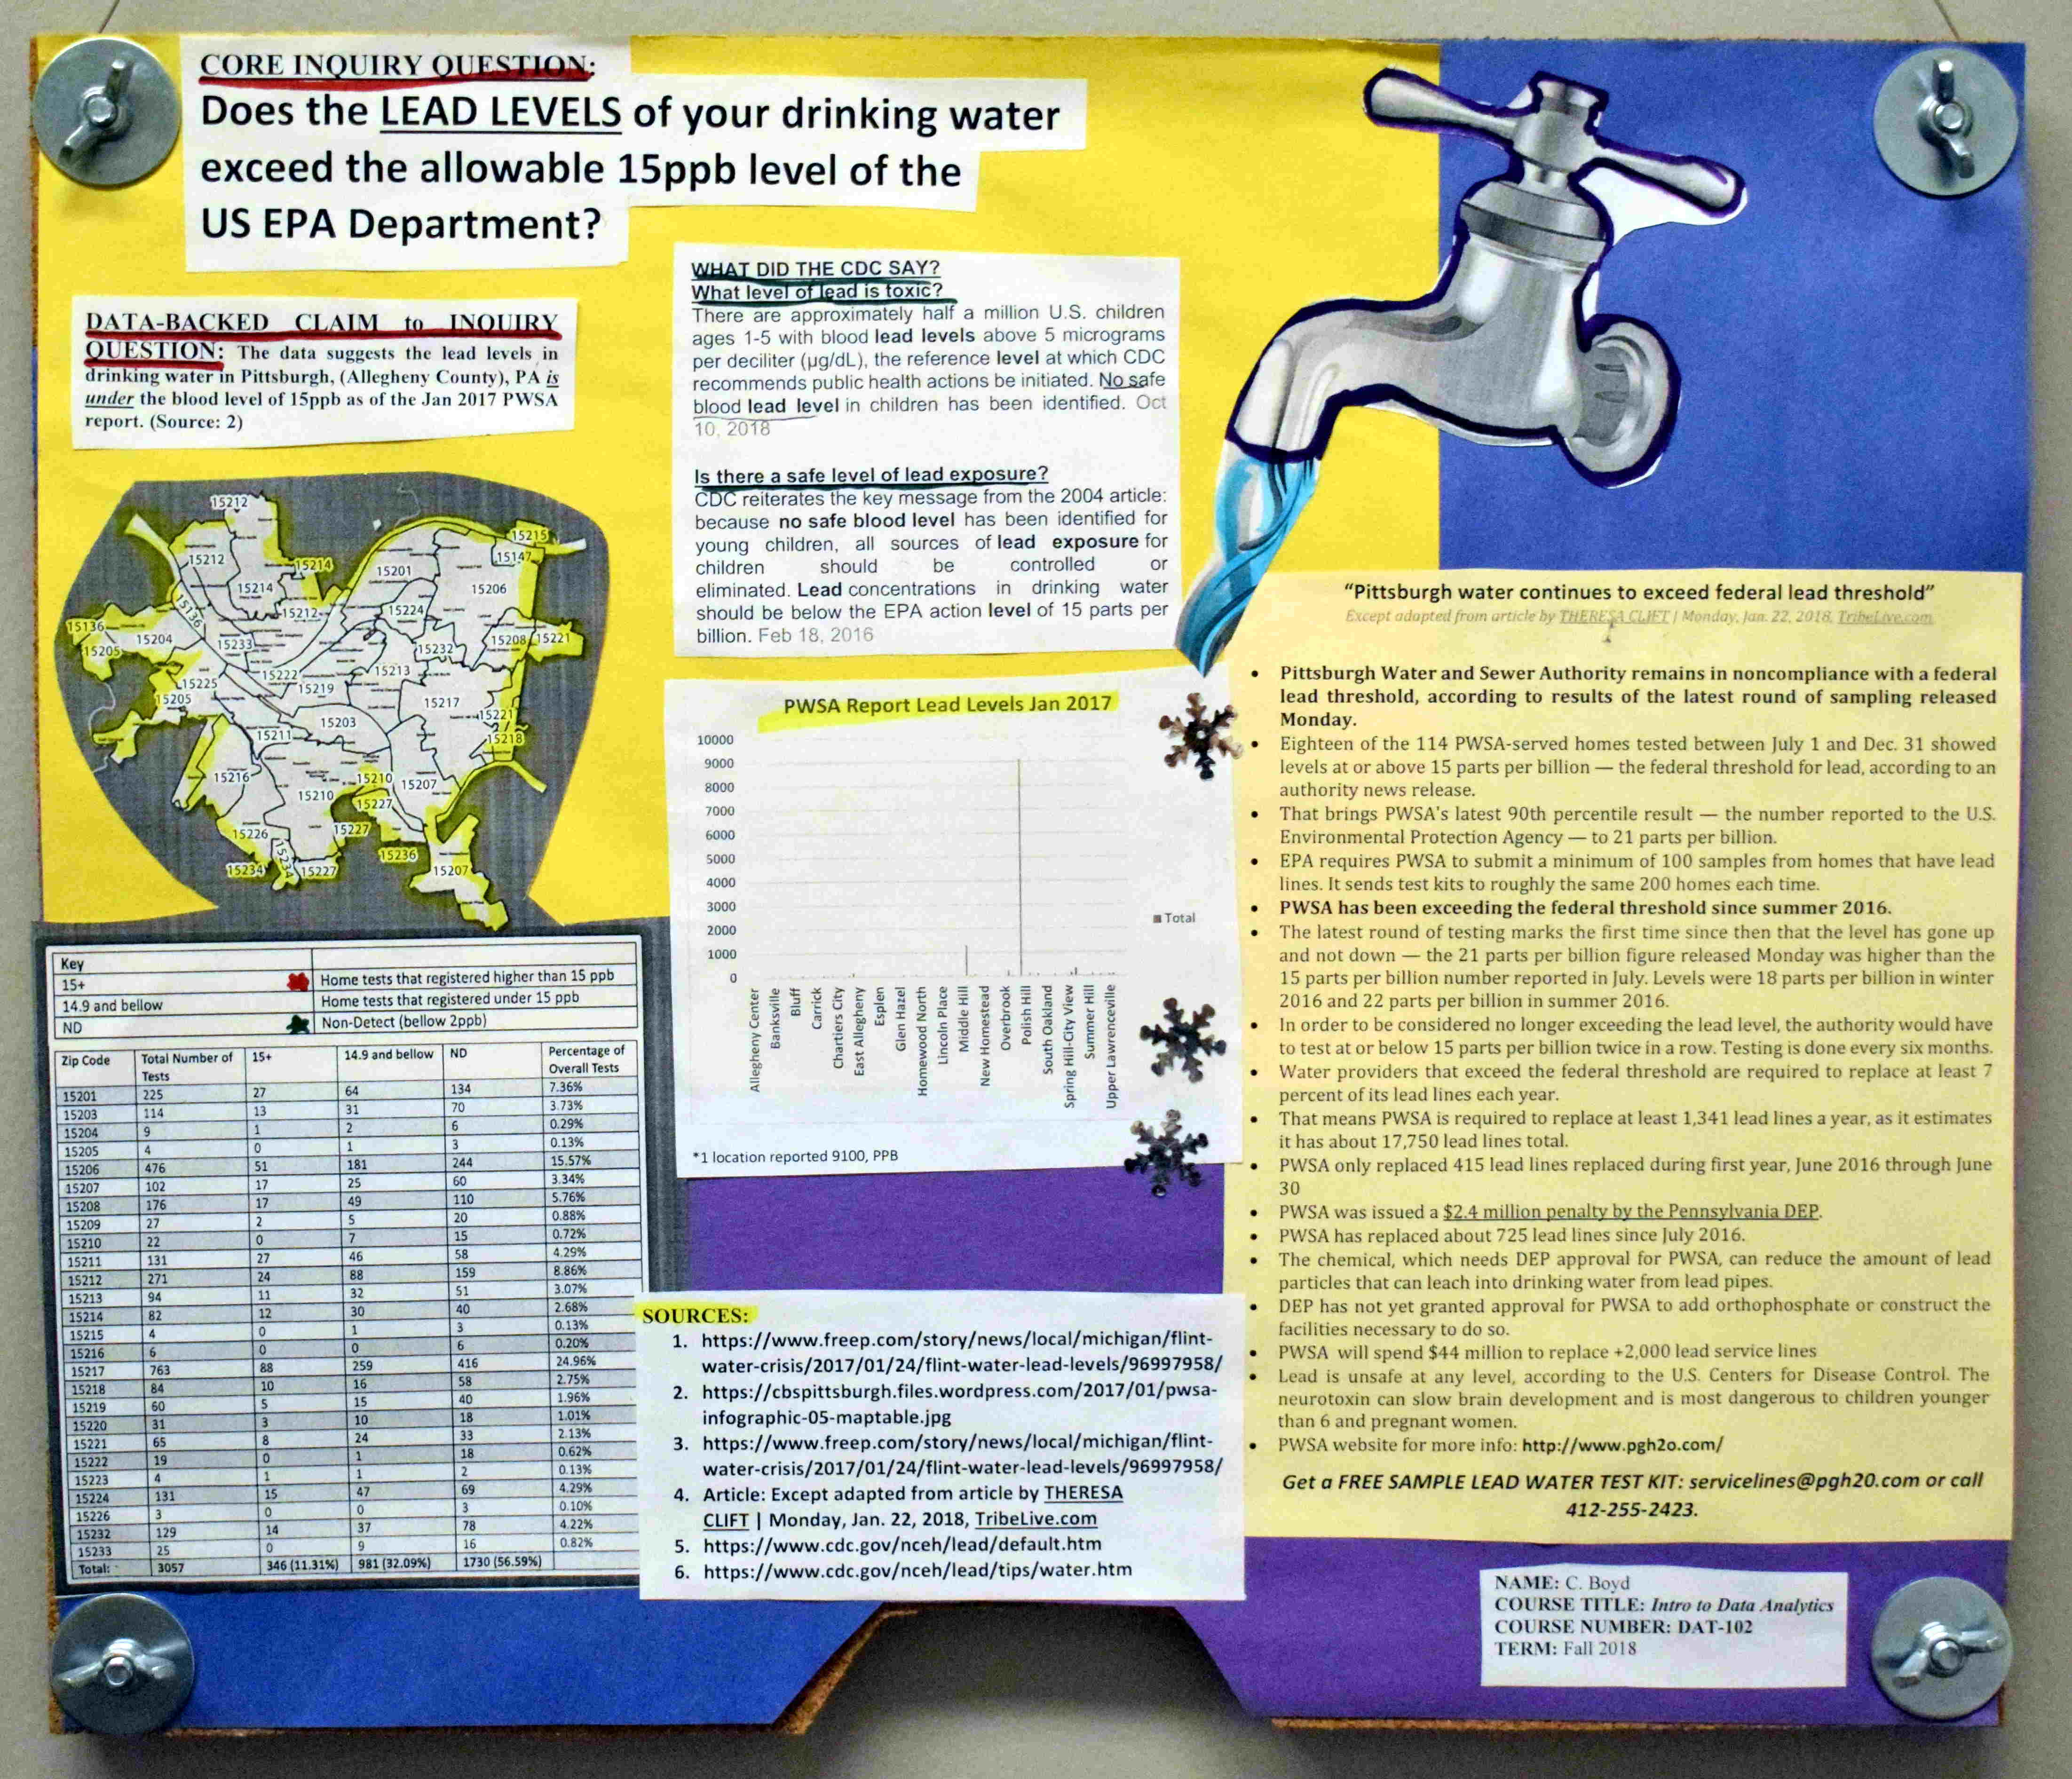
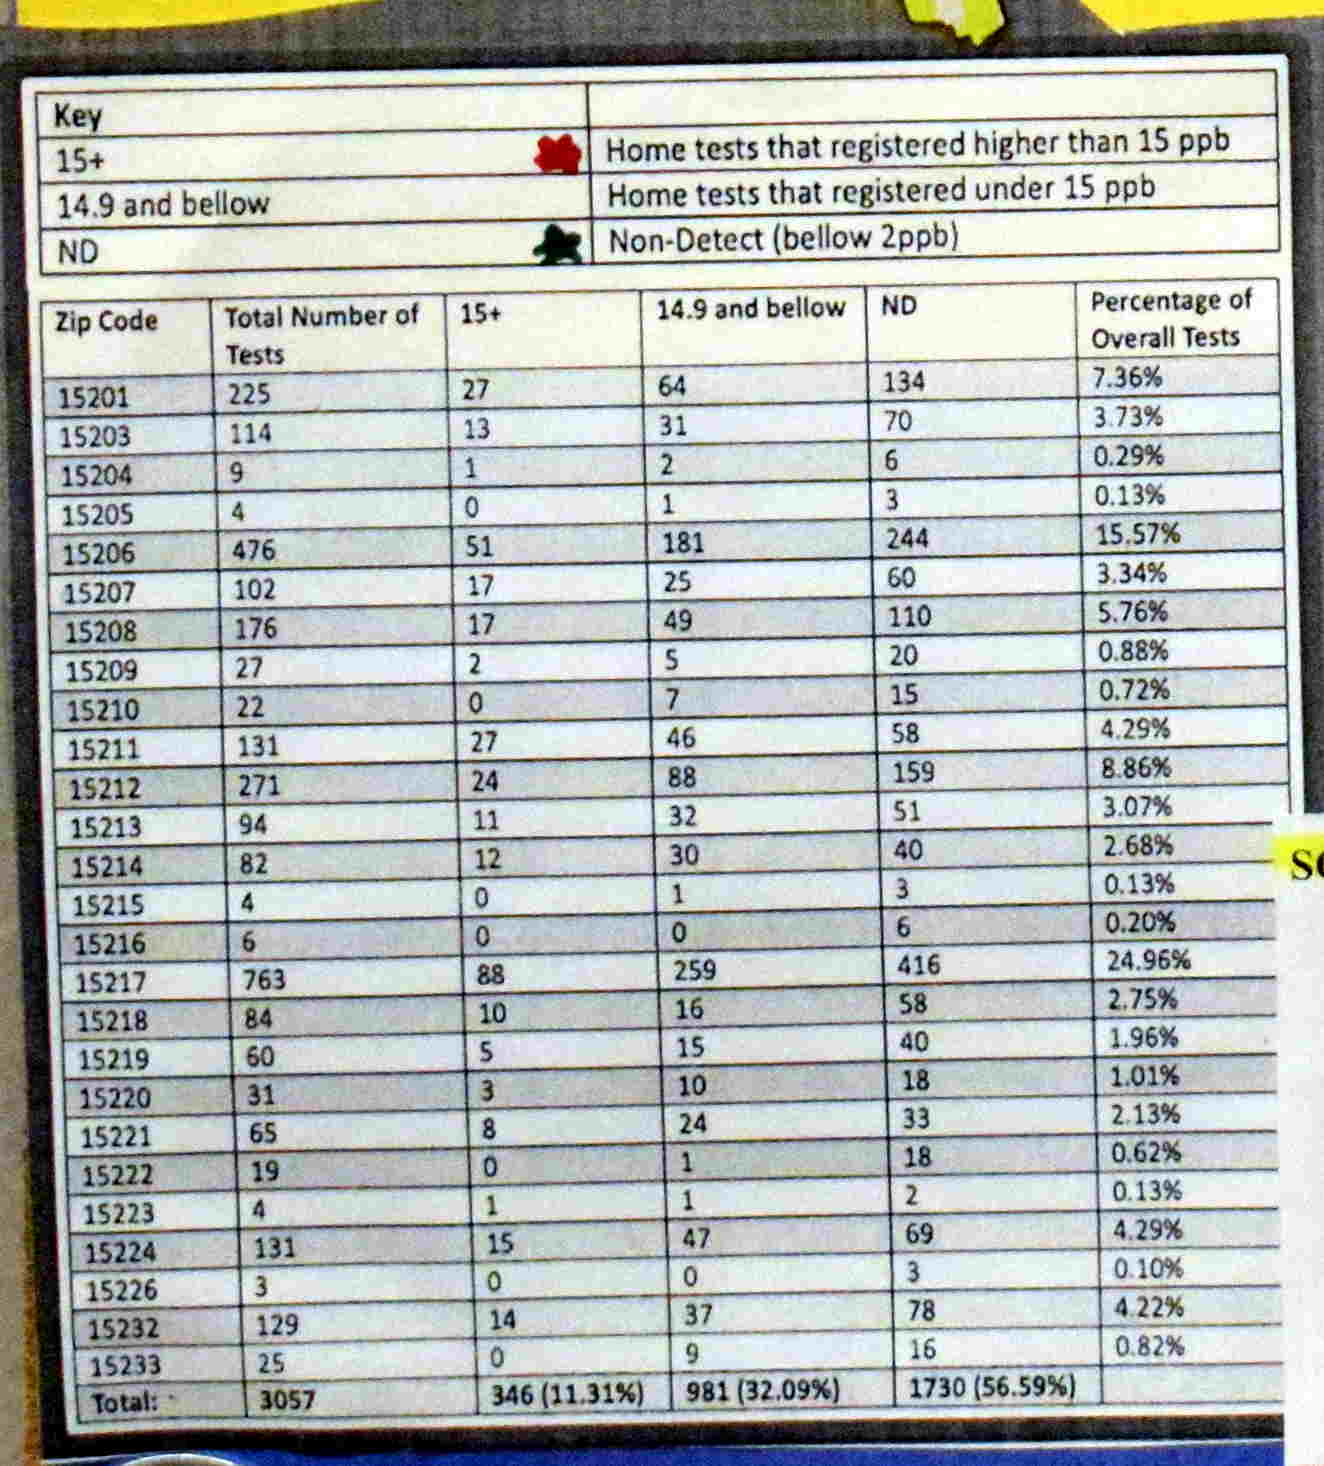
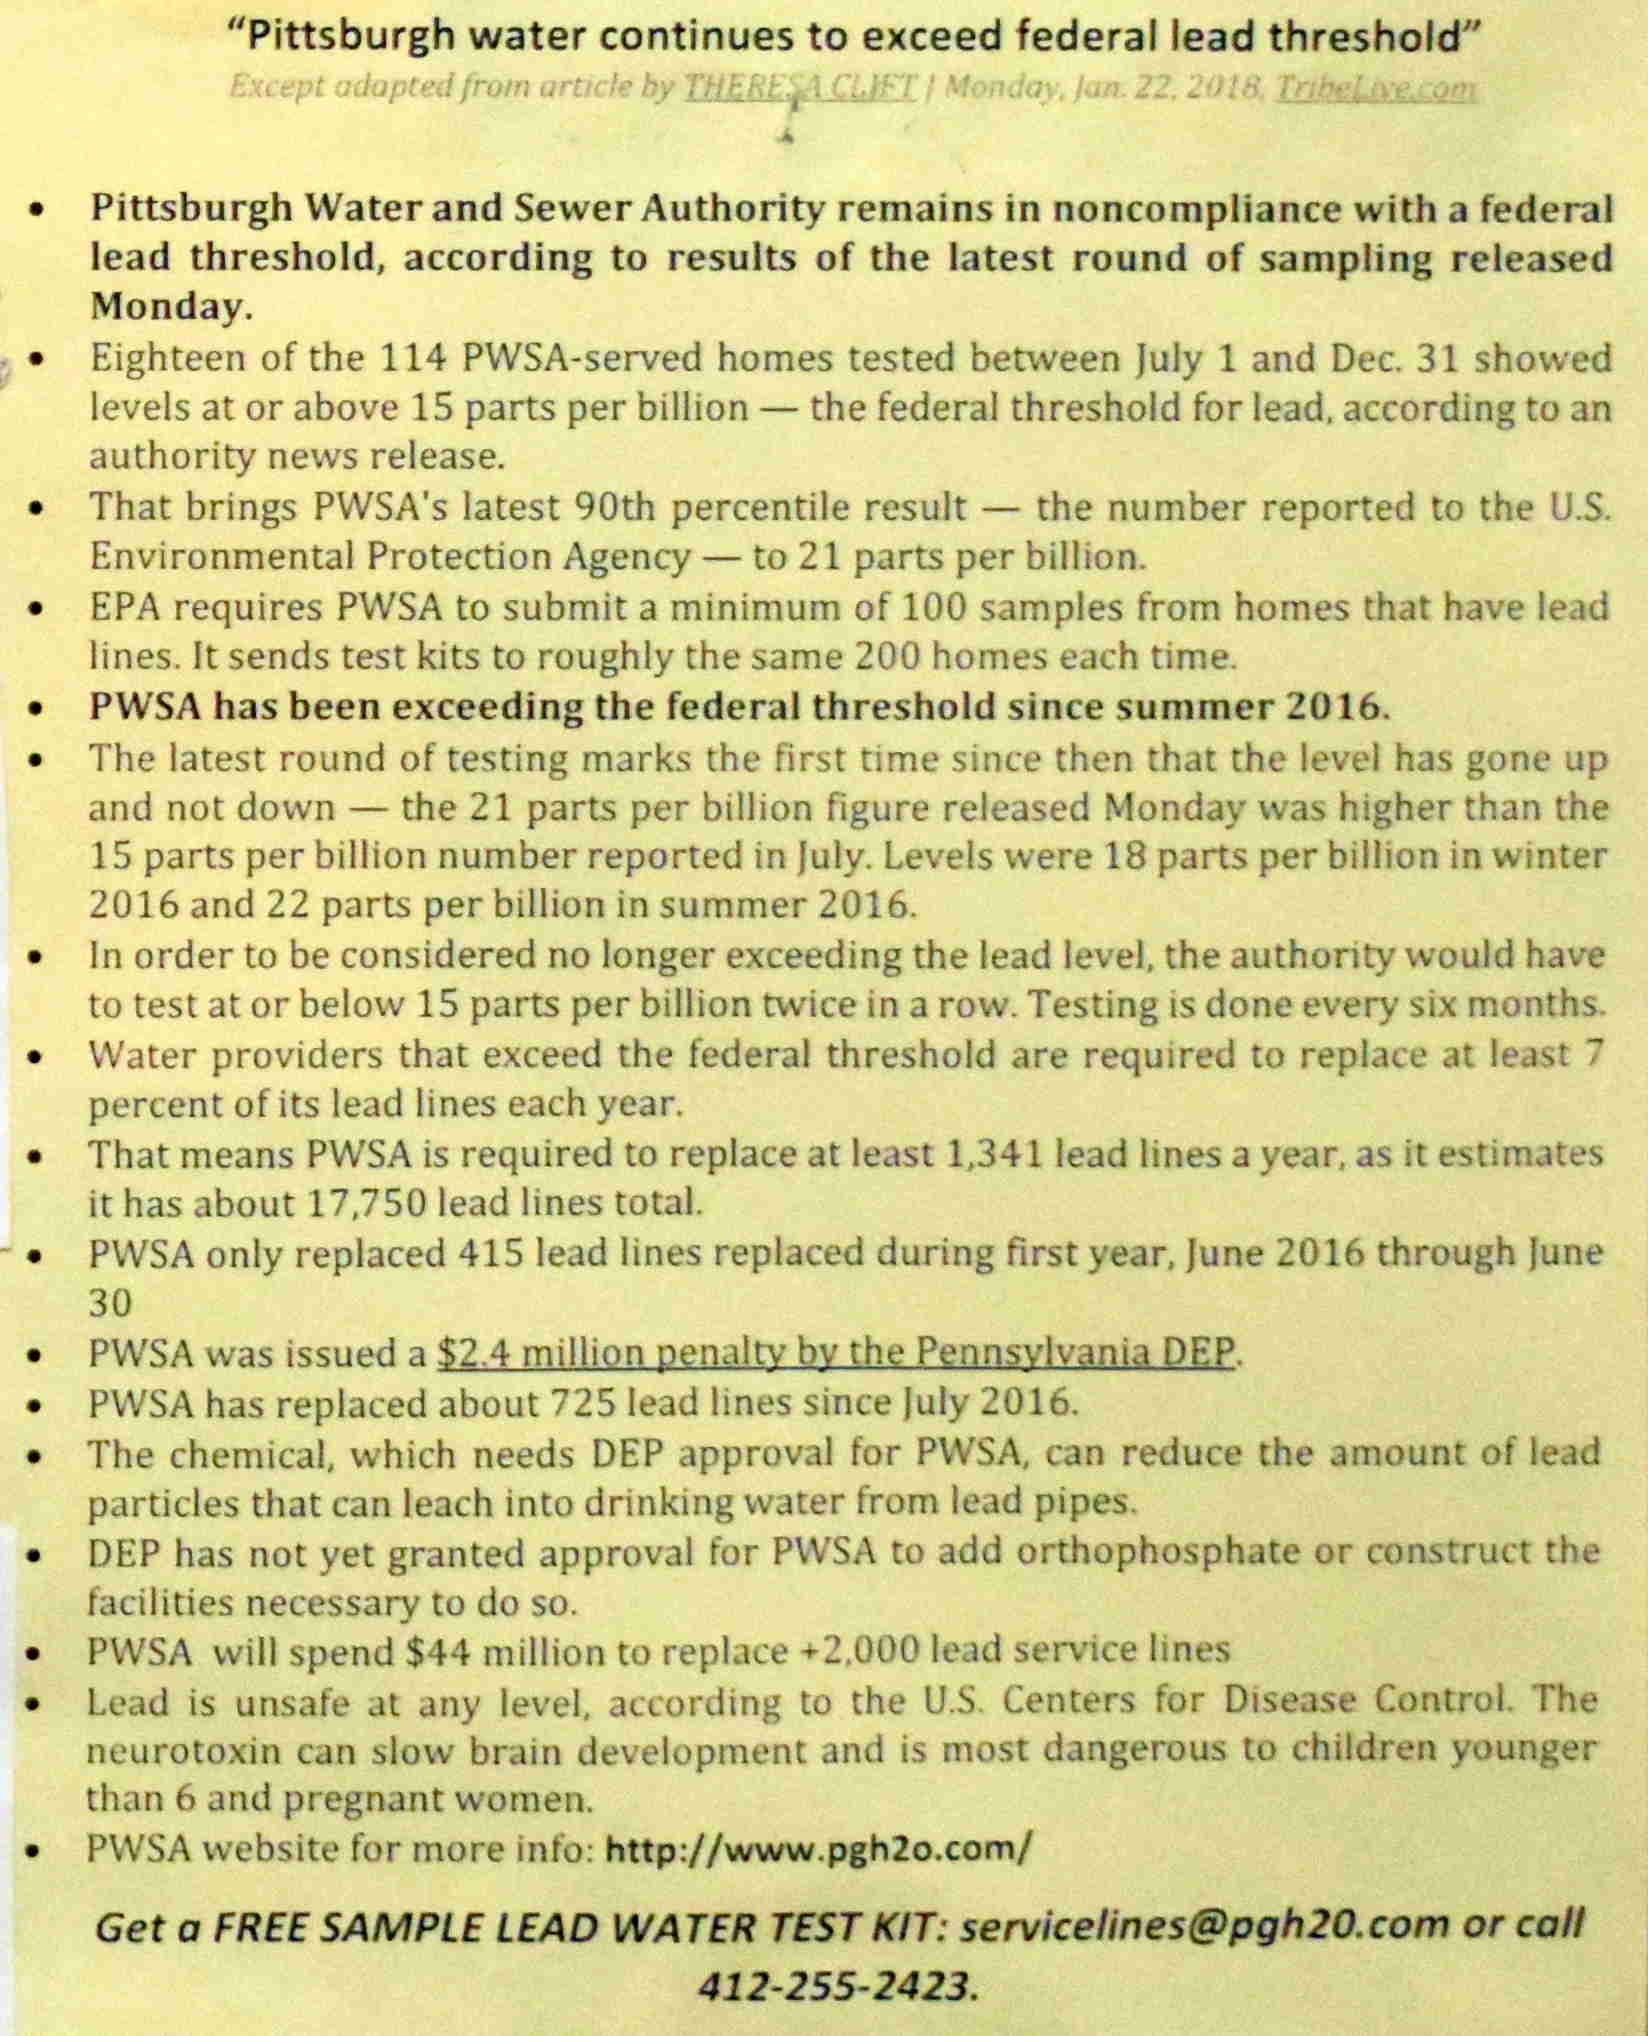
local_drinkToxic lead exposure in Pittsburgh
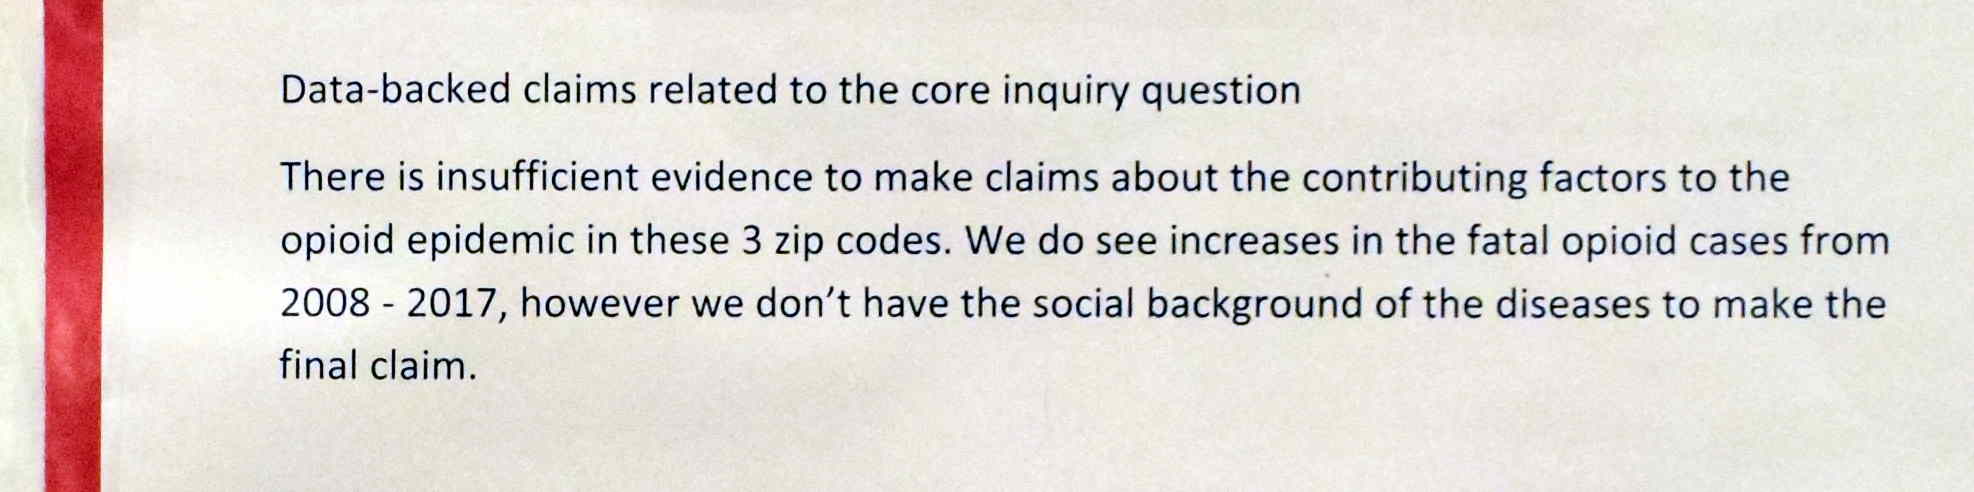
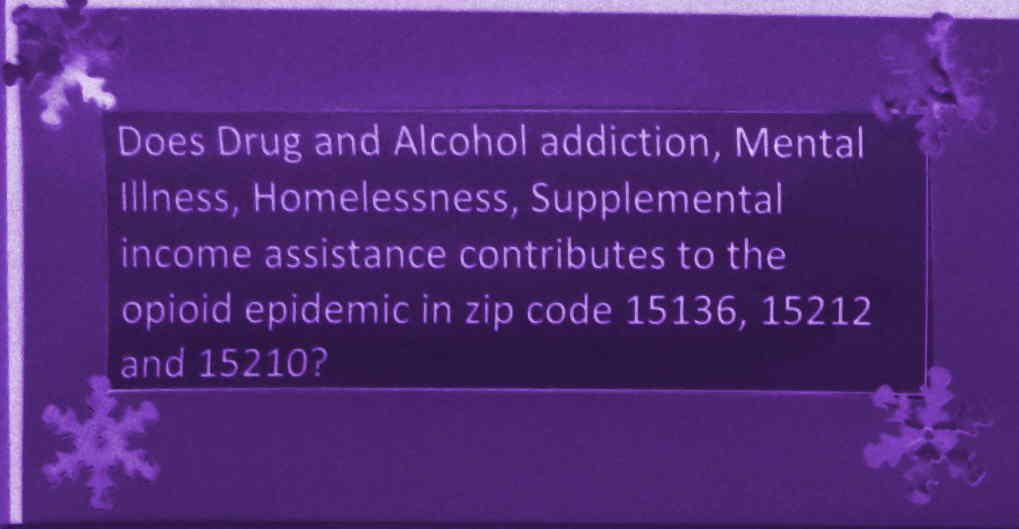
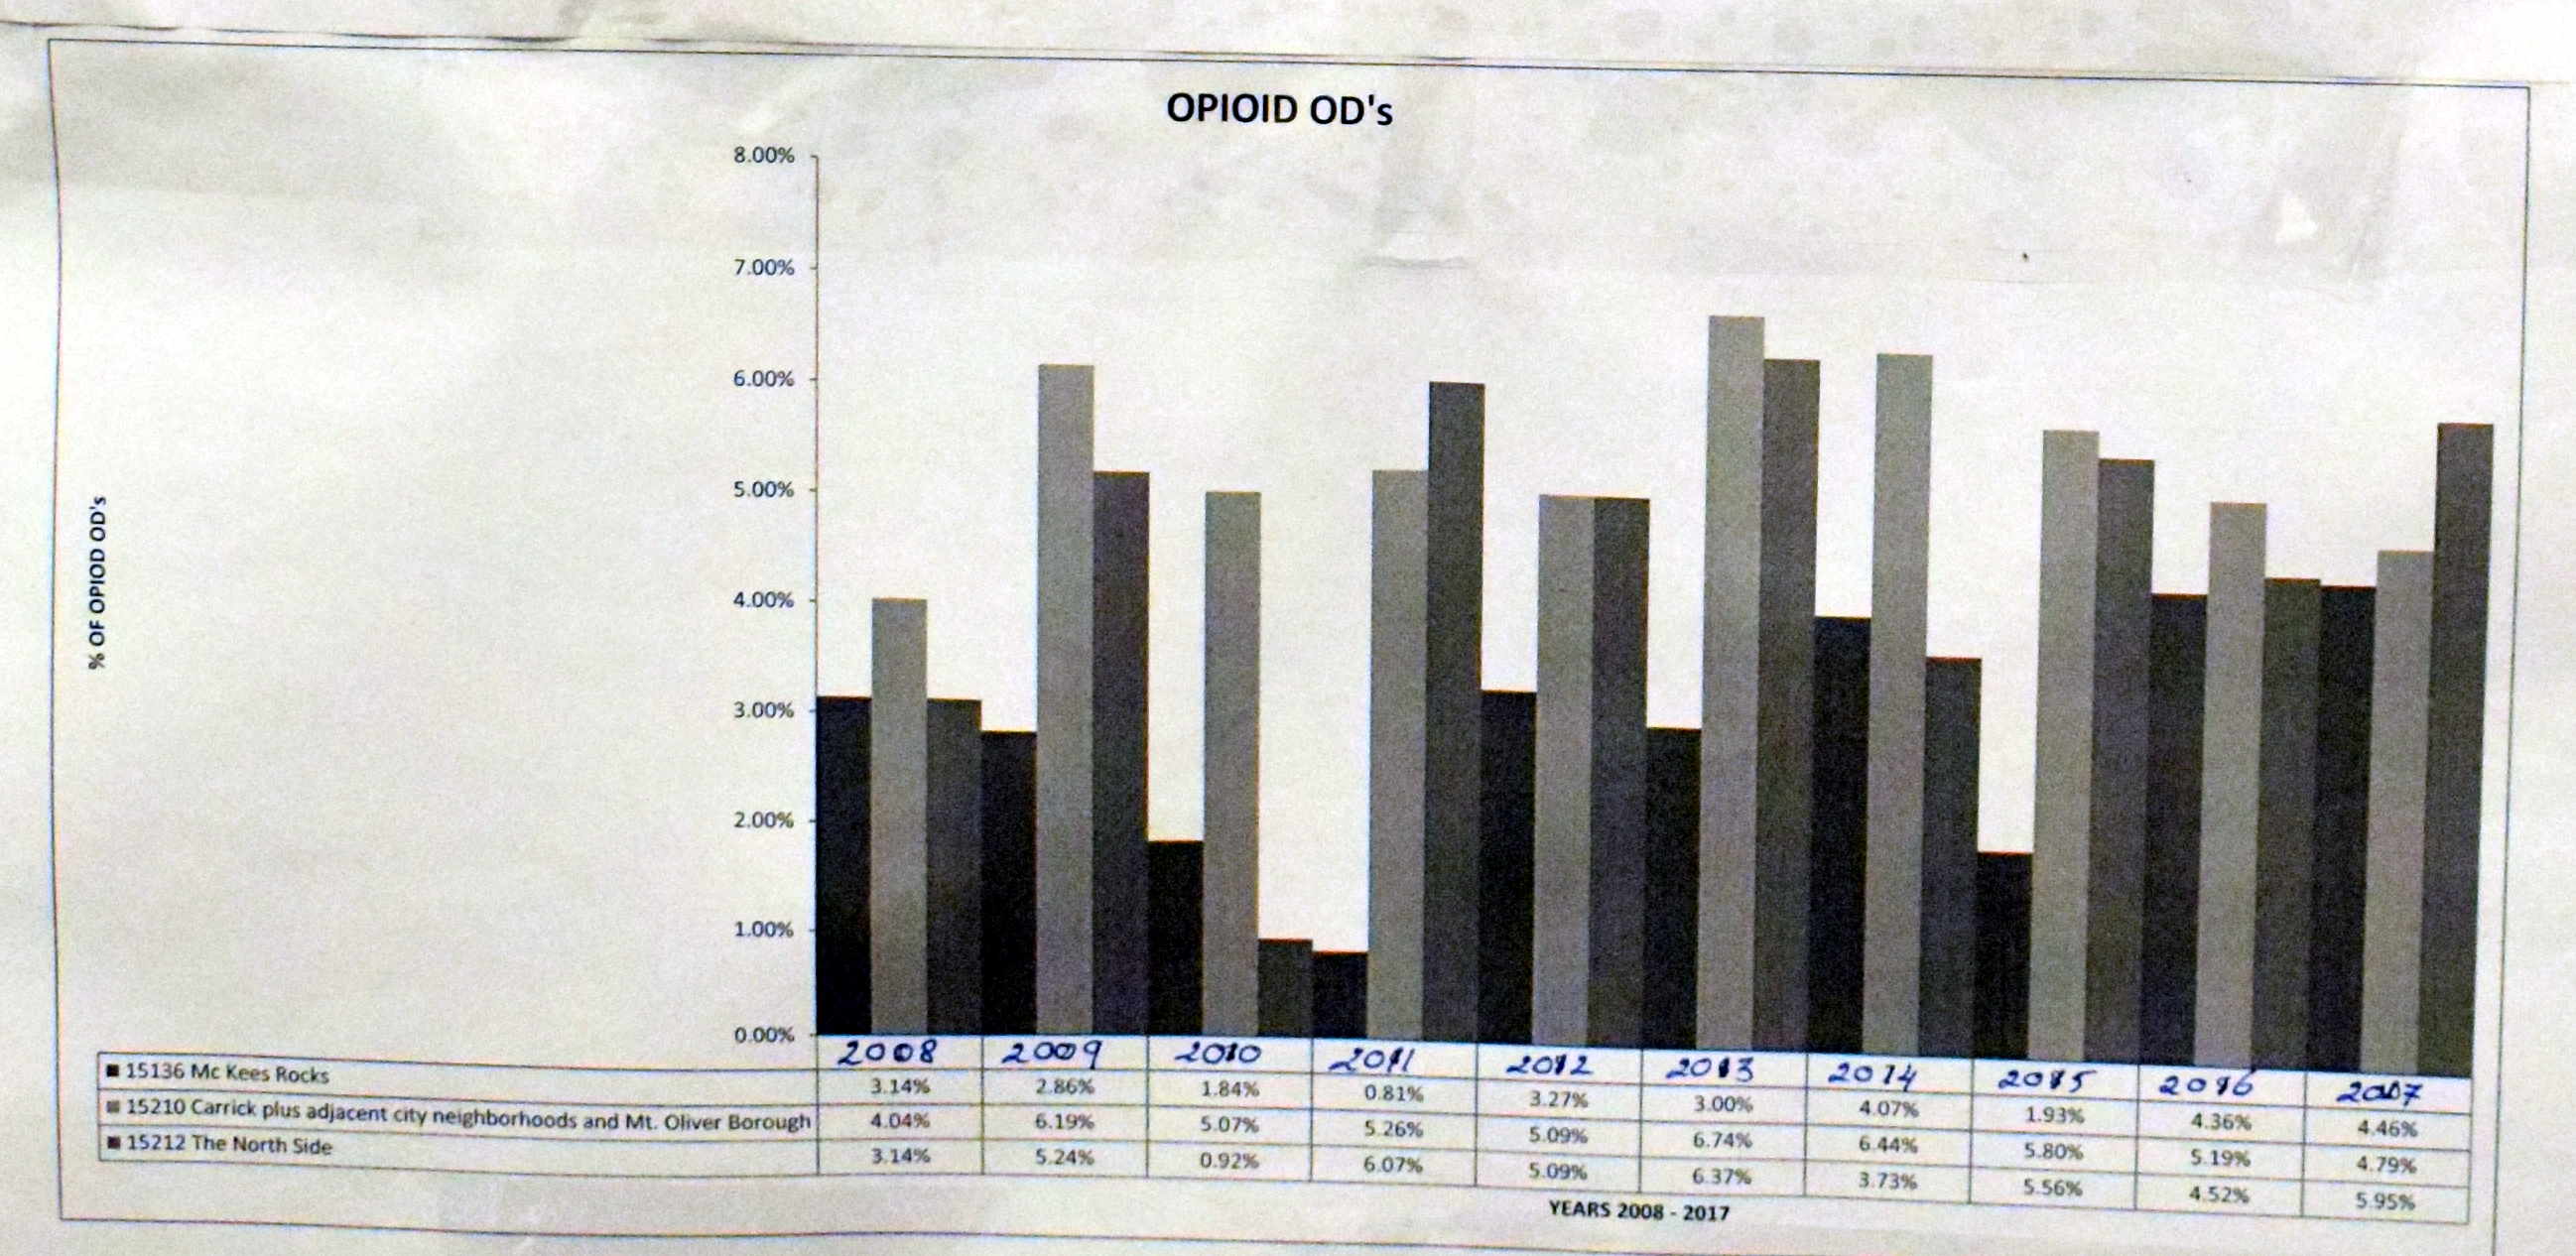
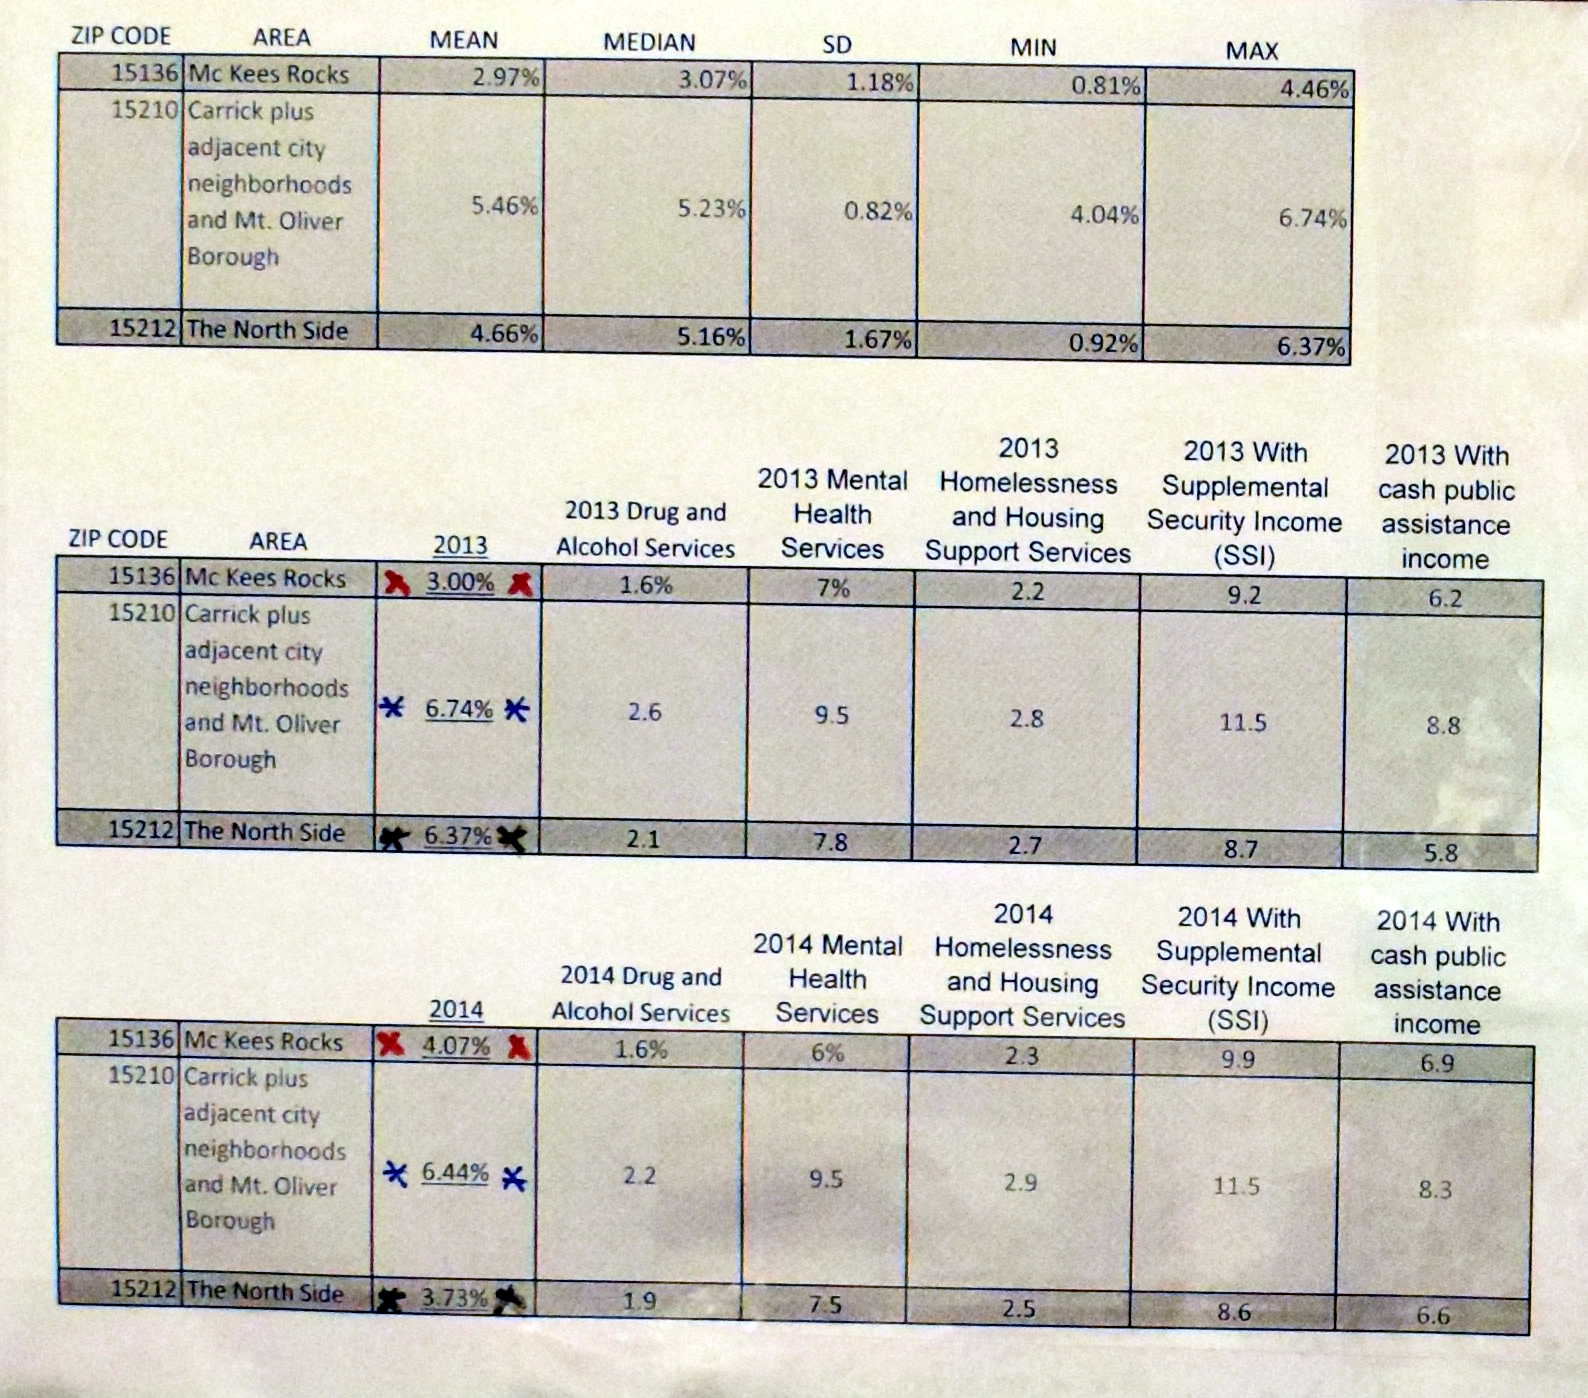
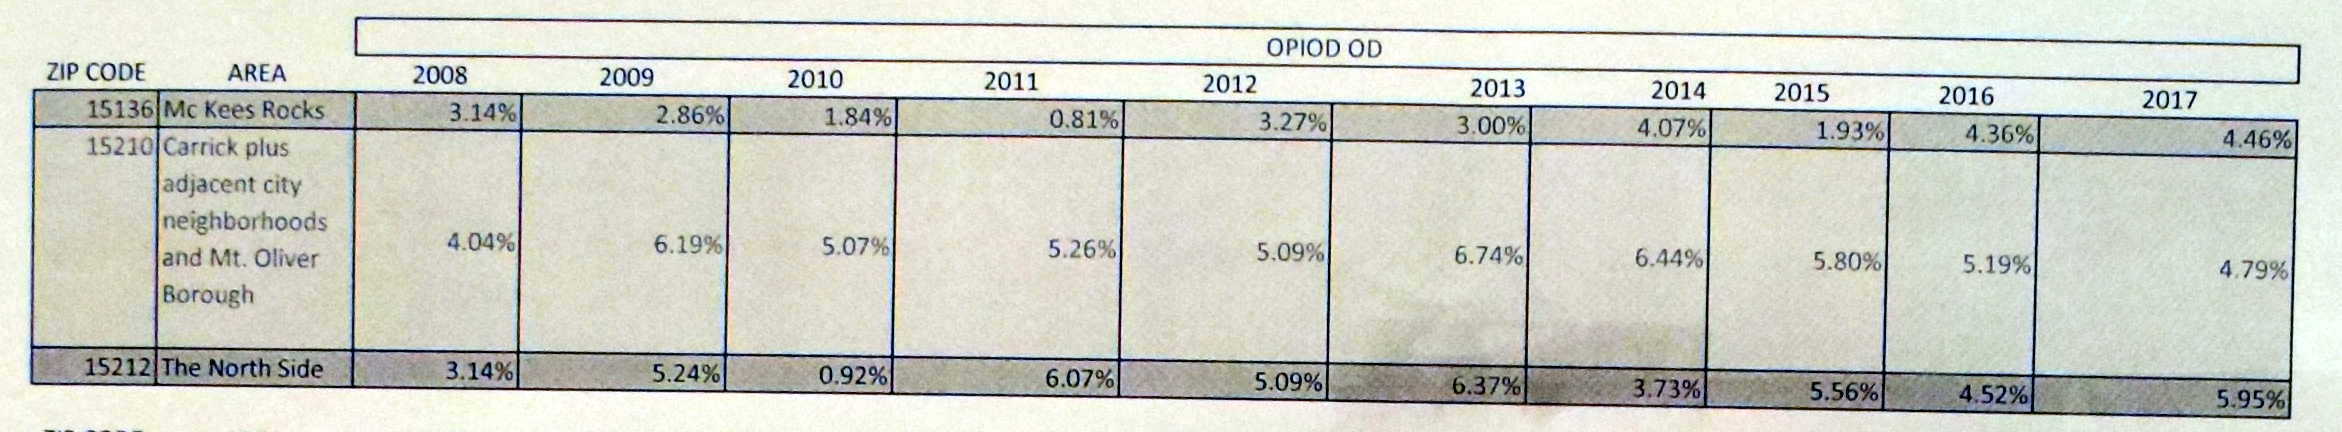
local_hospitalDrivers of opioid overdoses in Pittsburgh
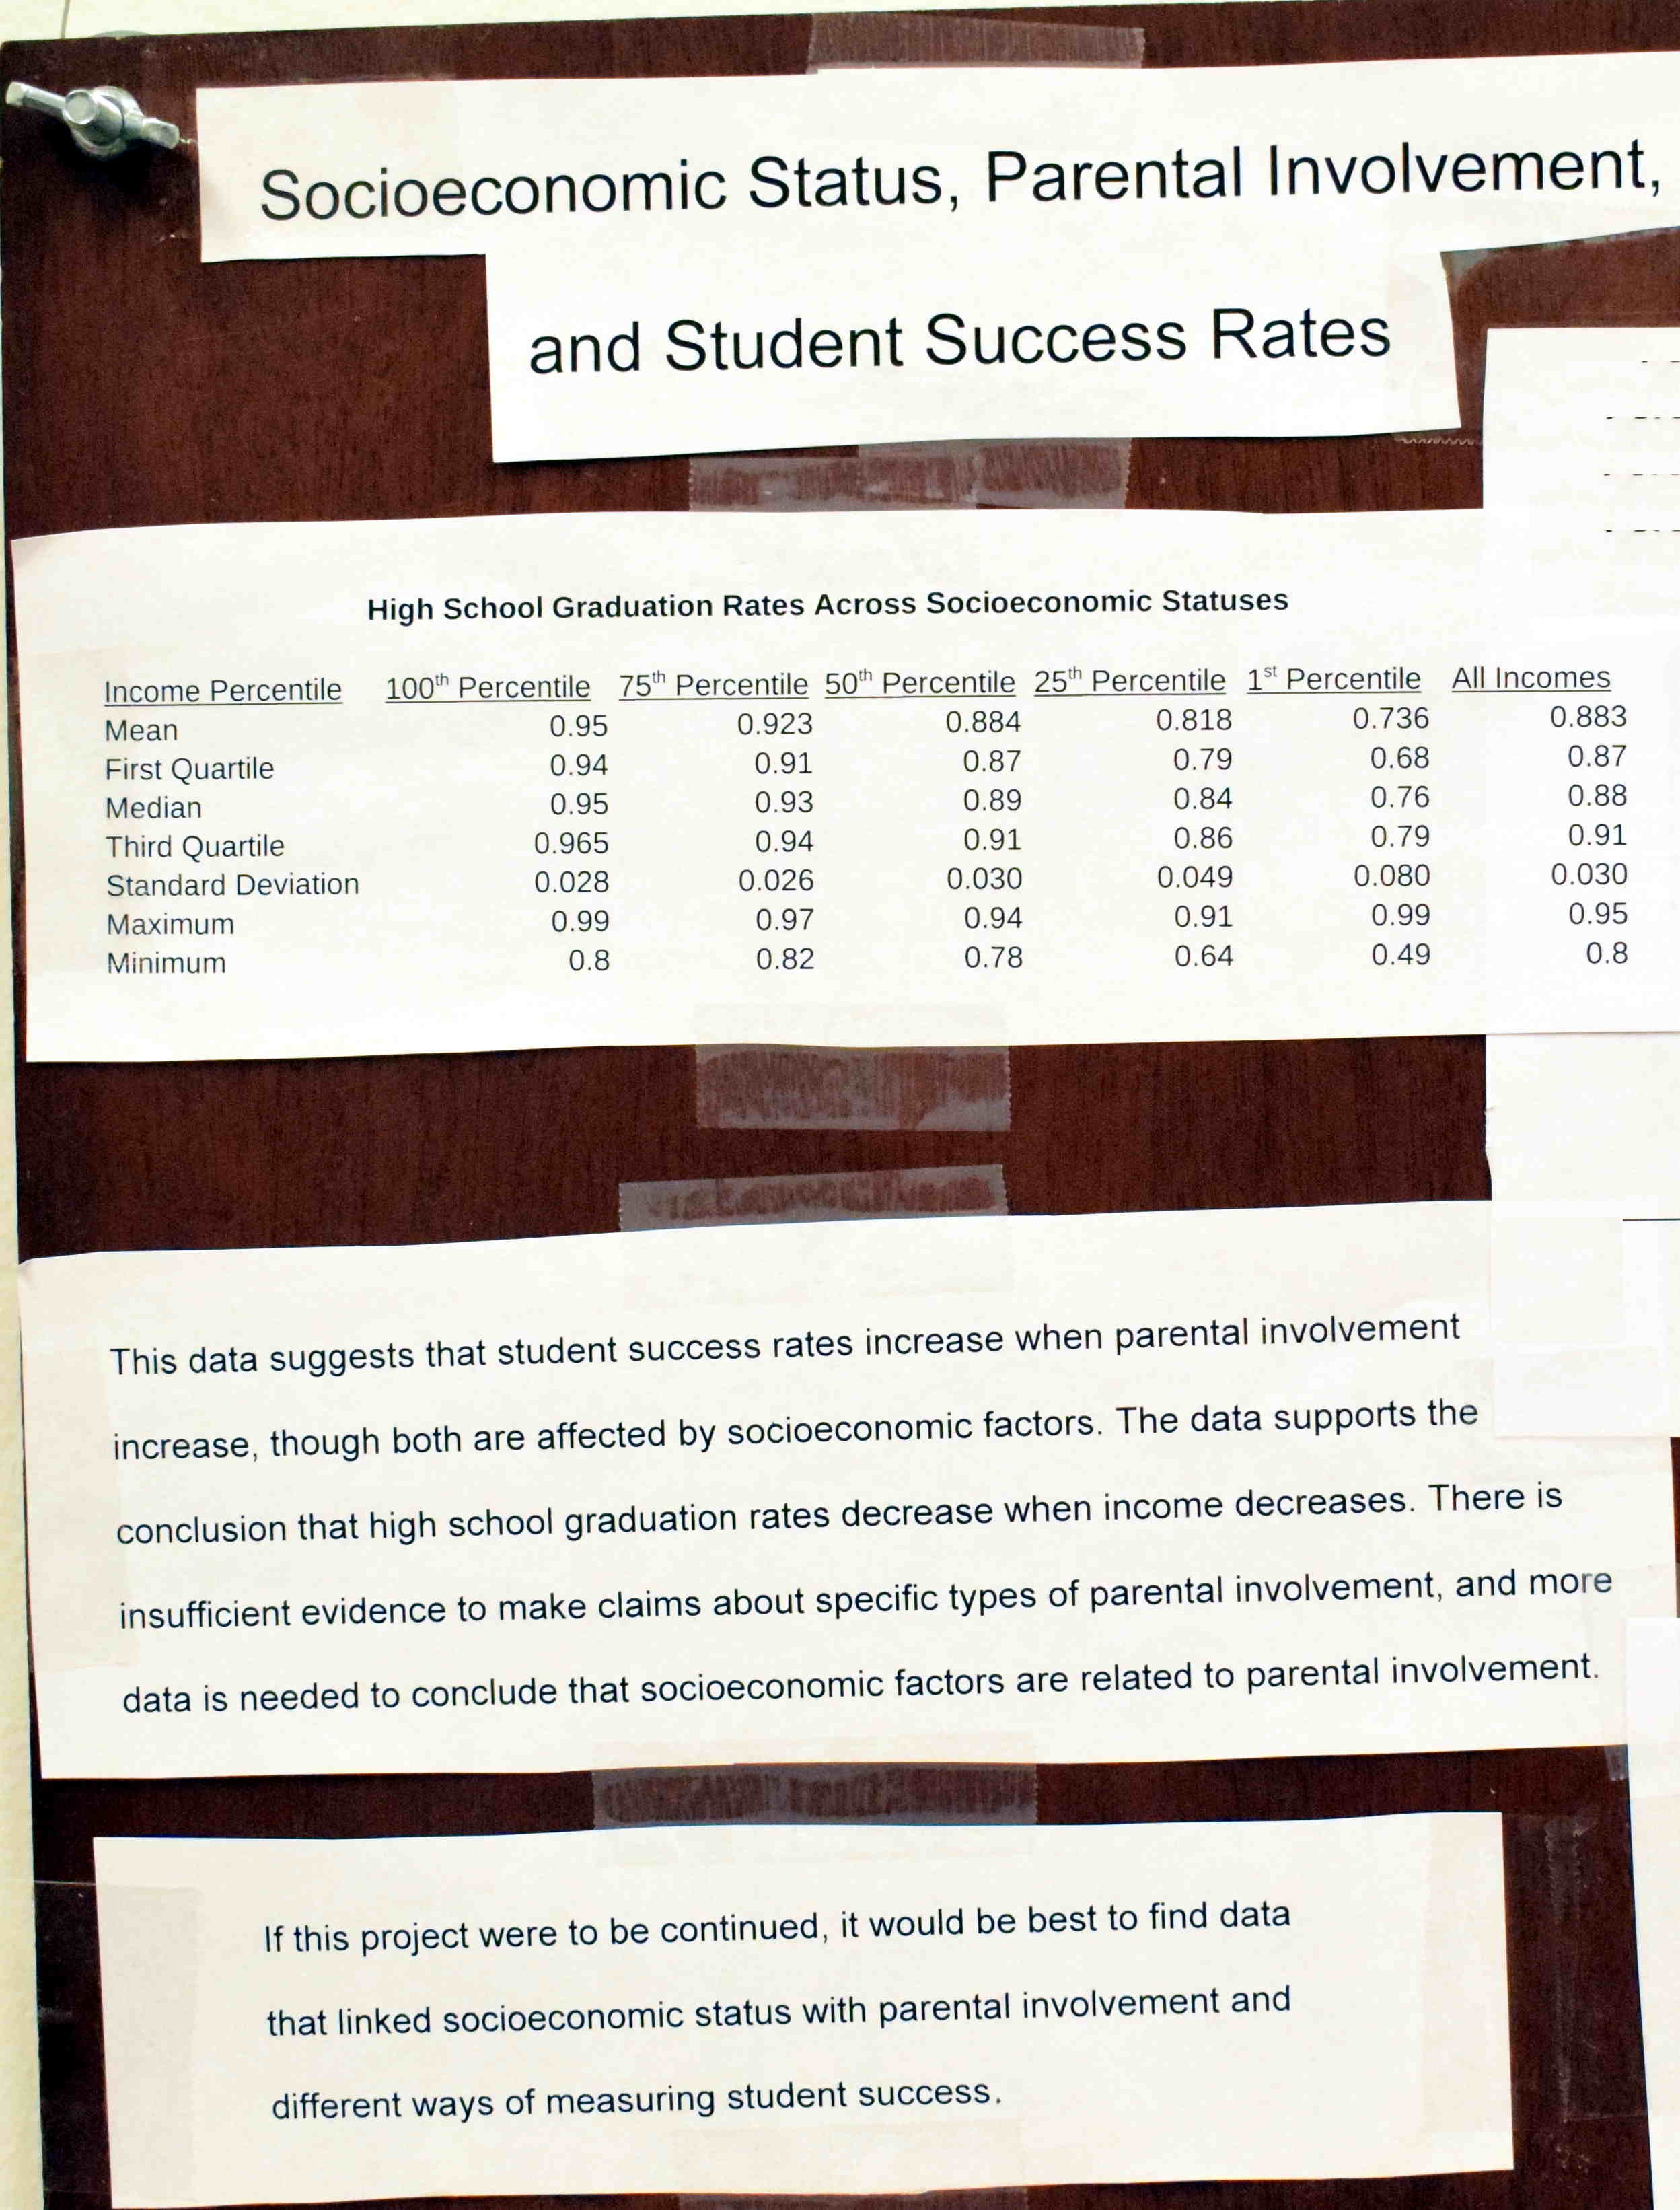
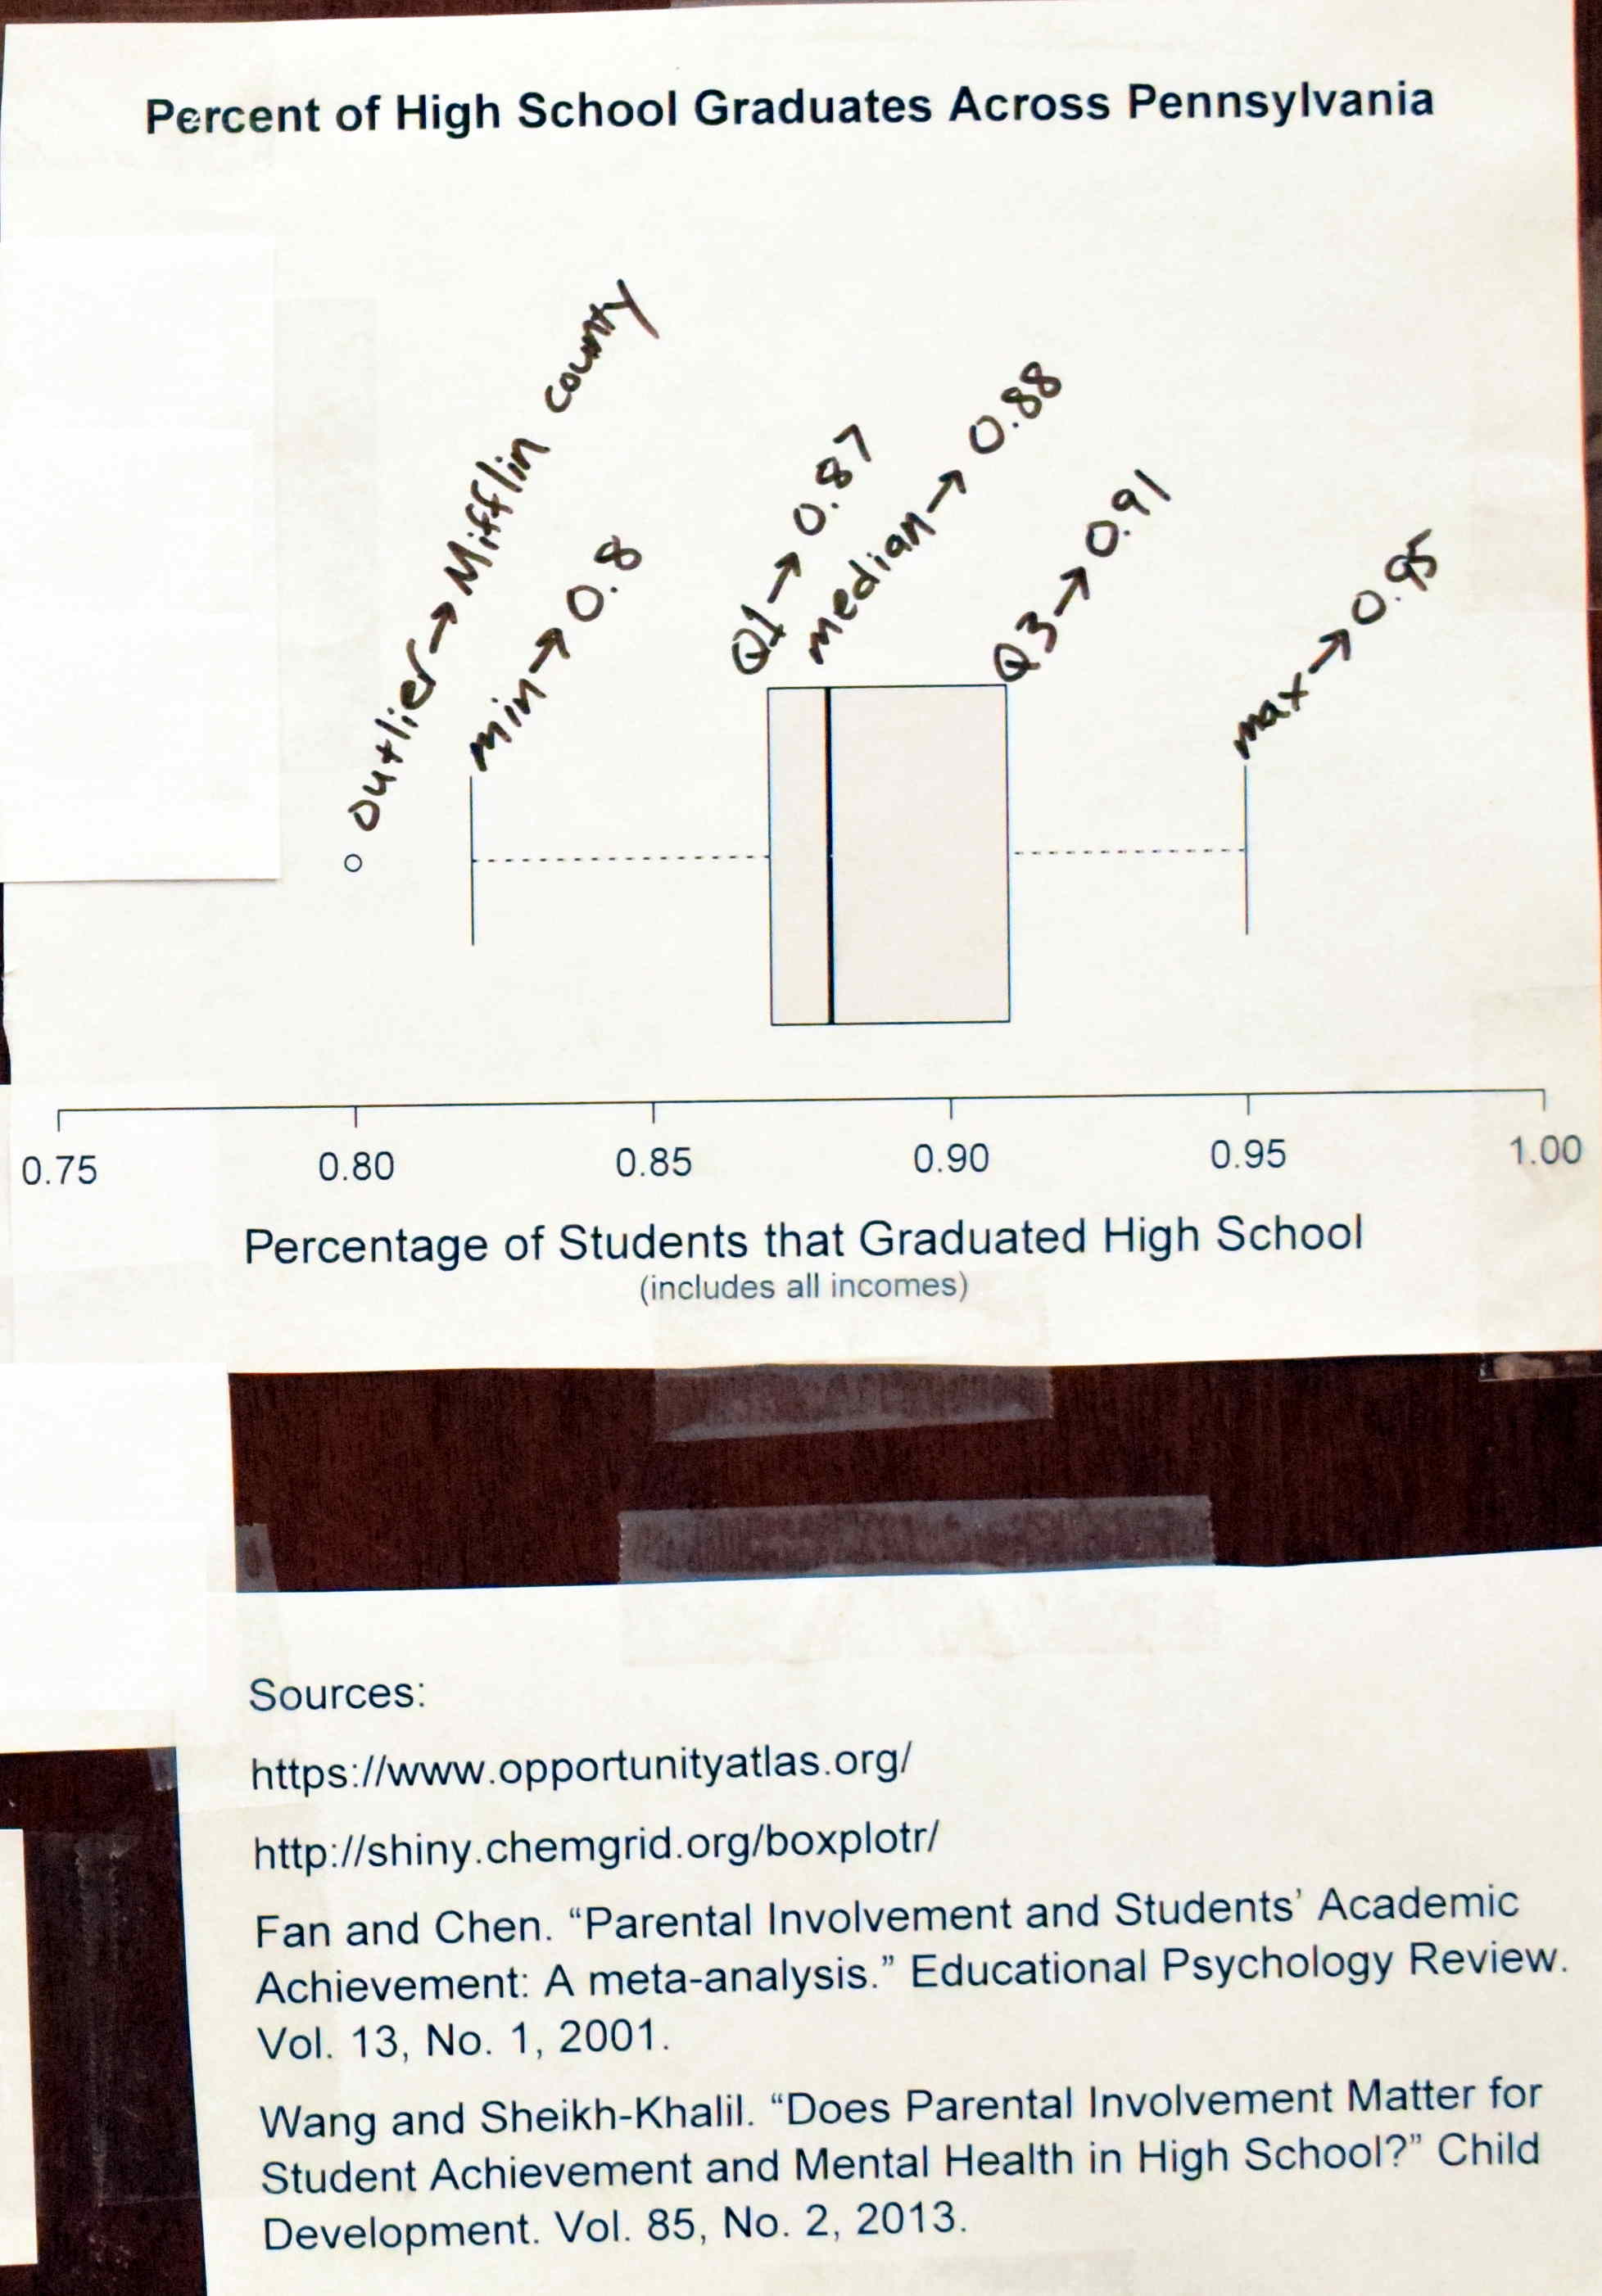
local_librarySocioeconomic status and high school graduation rates
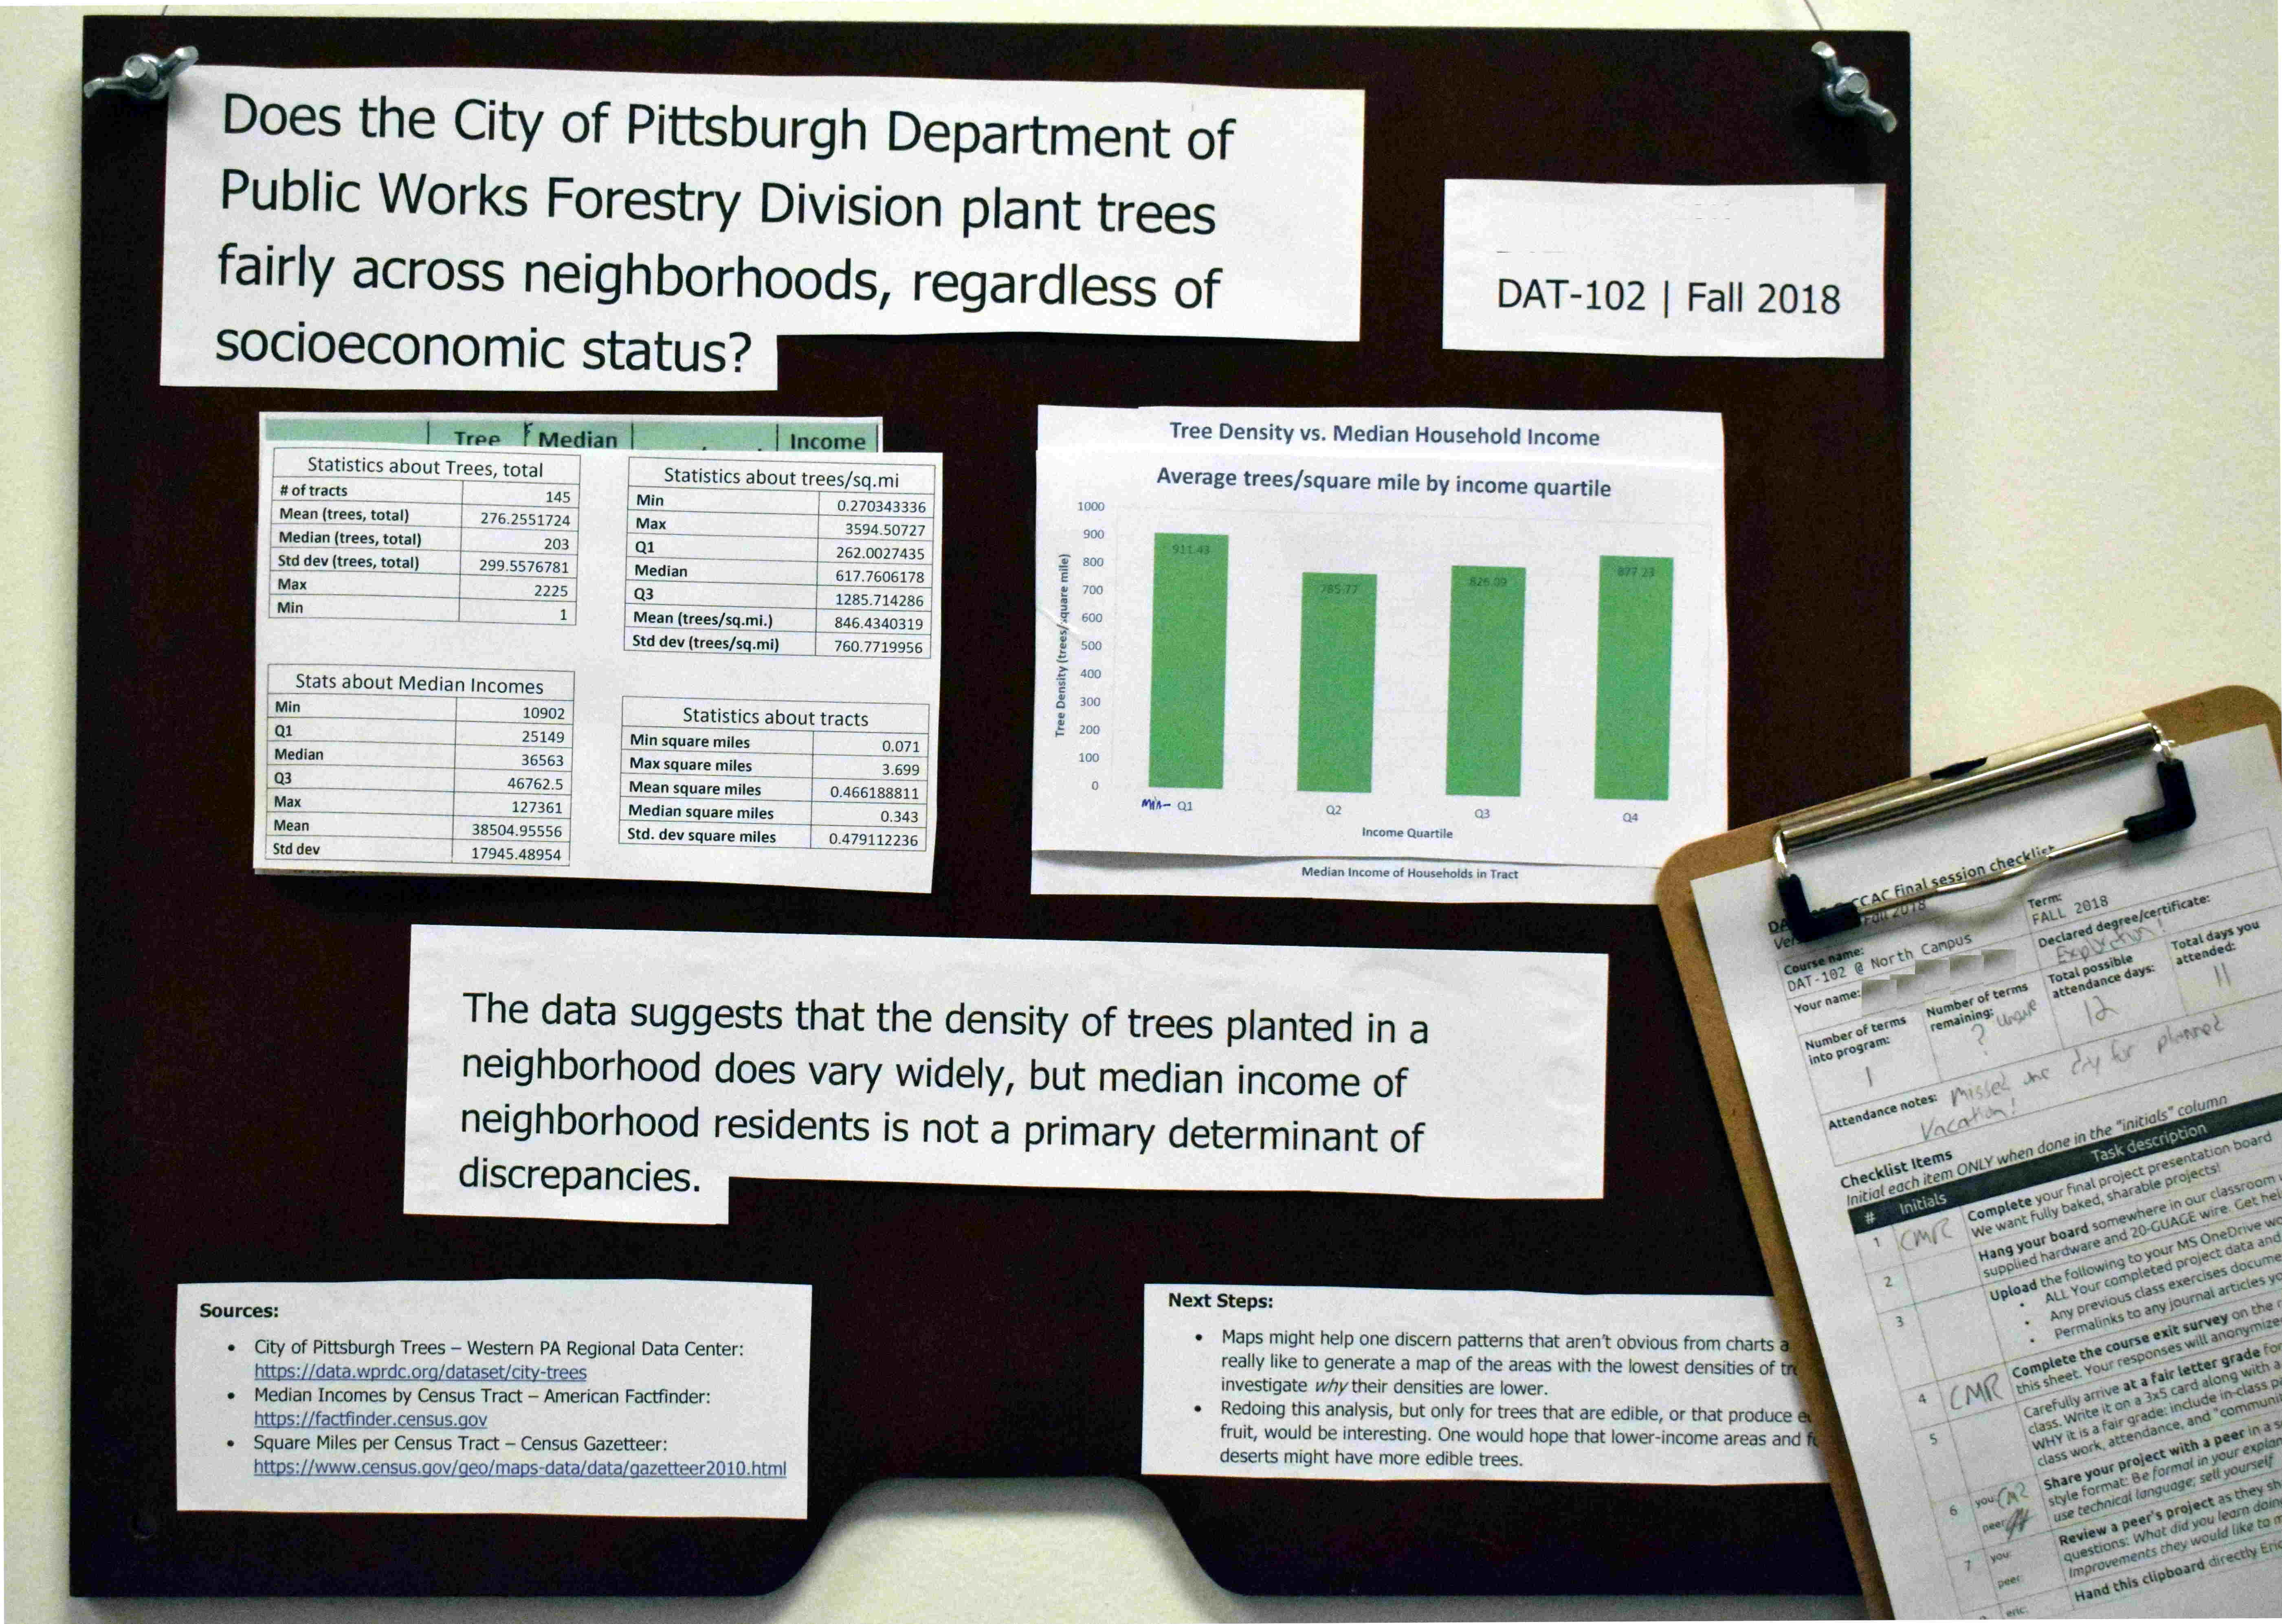
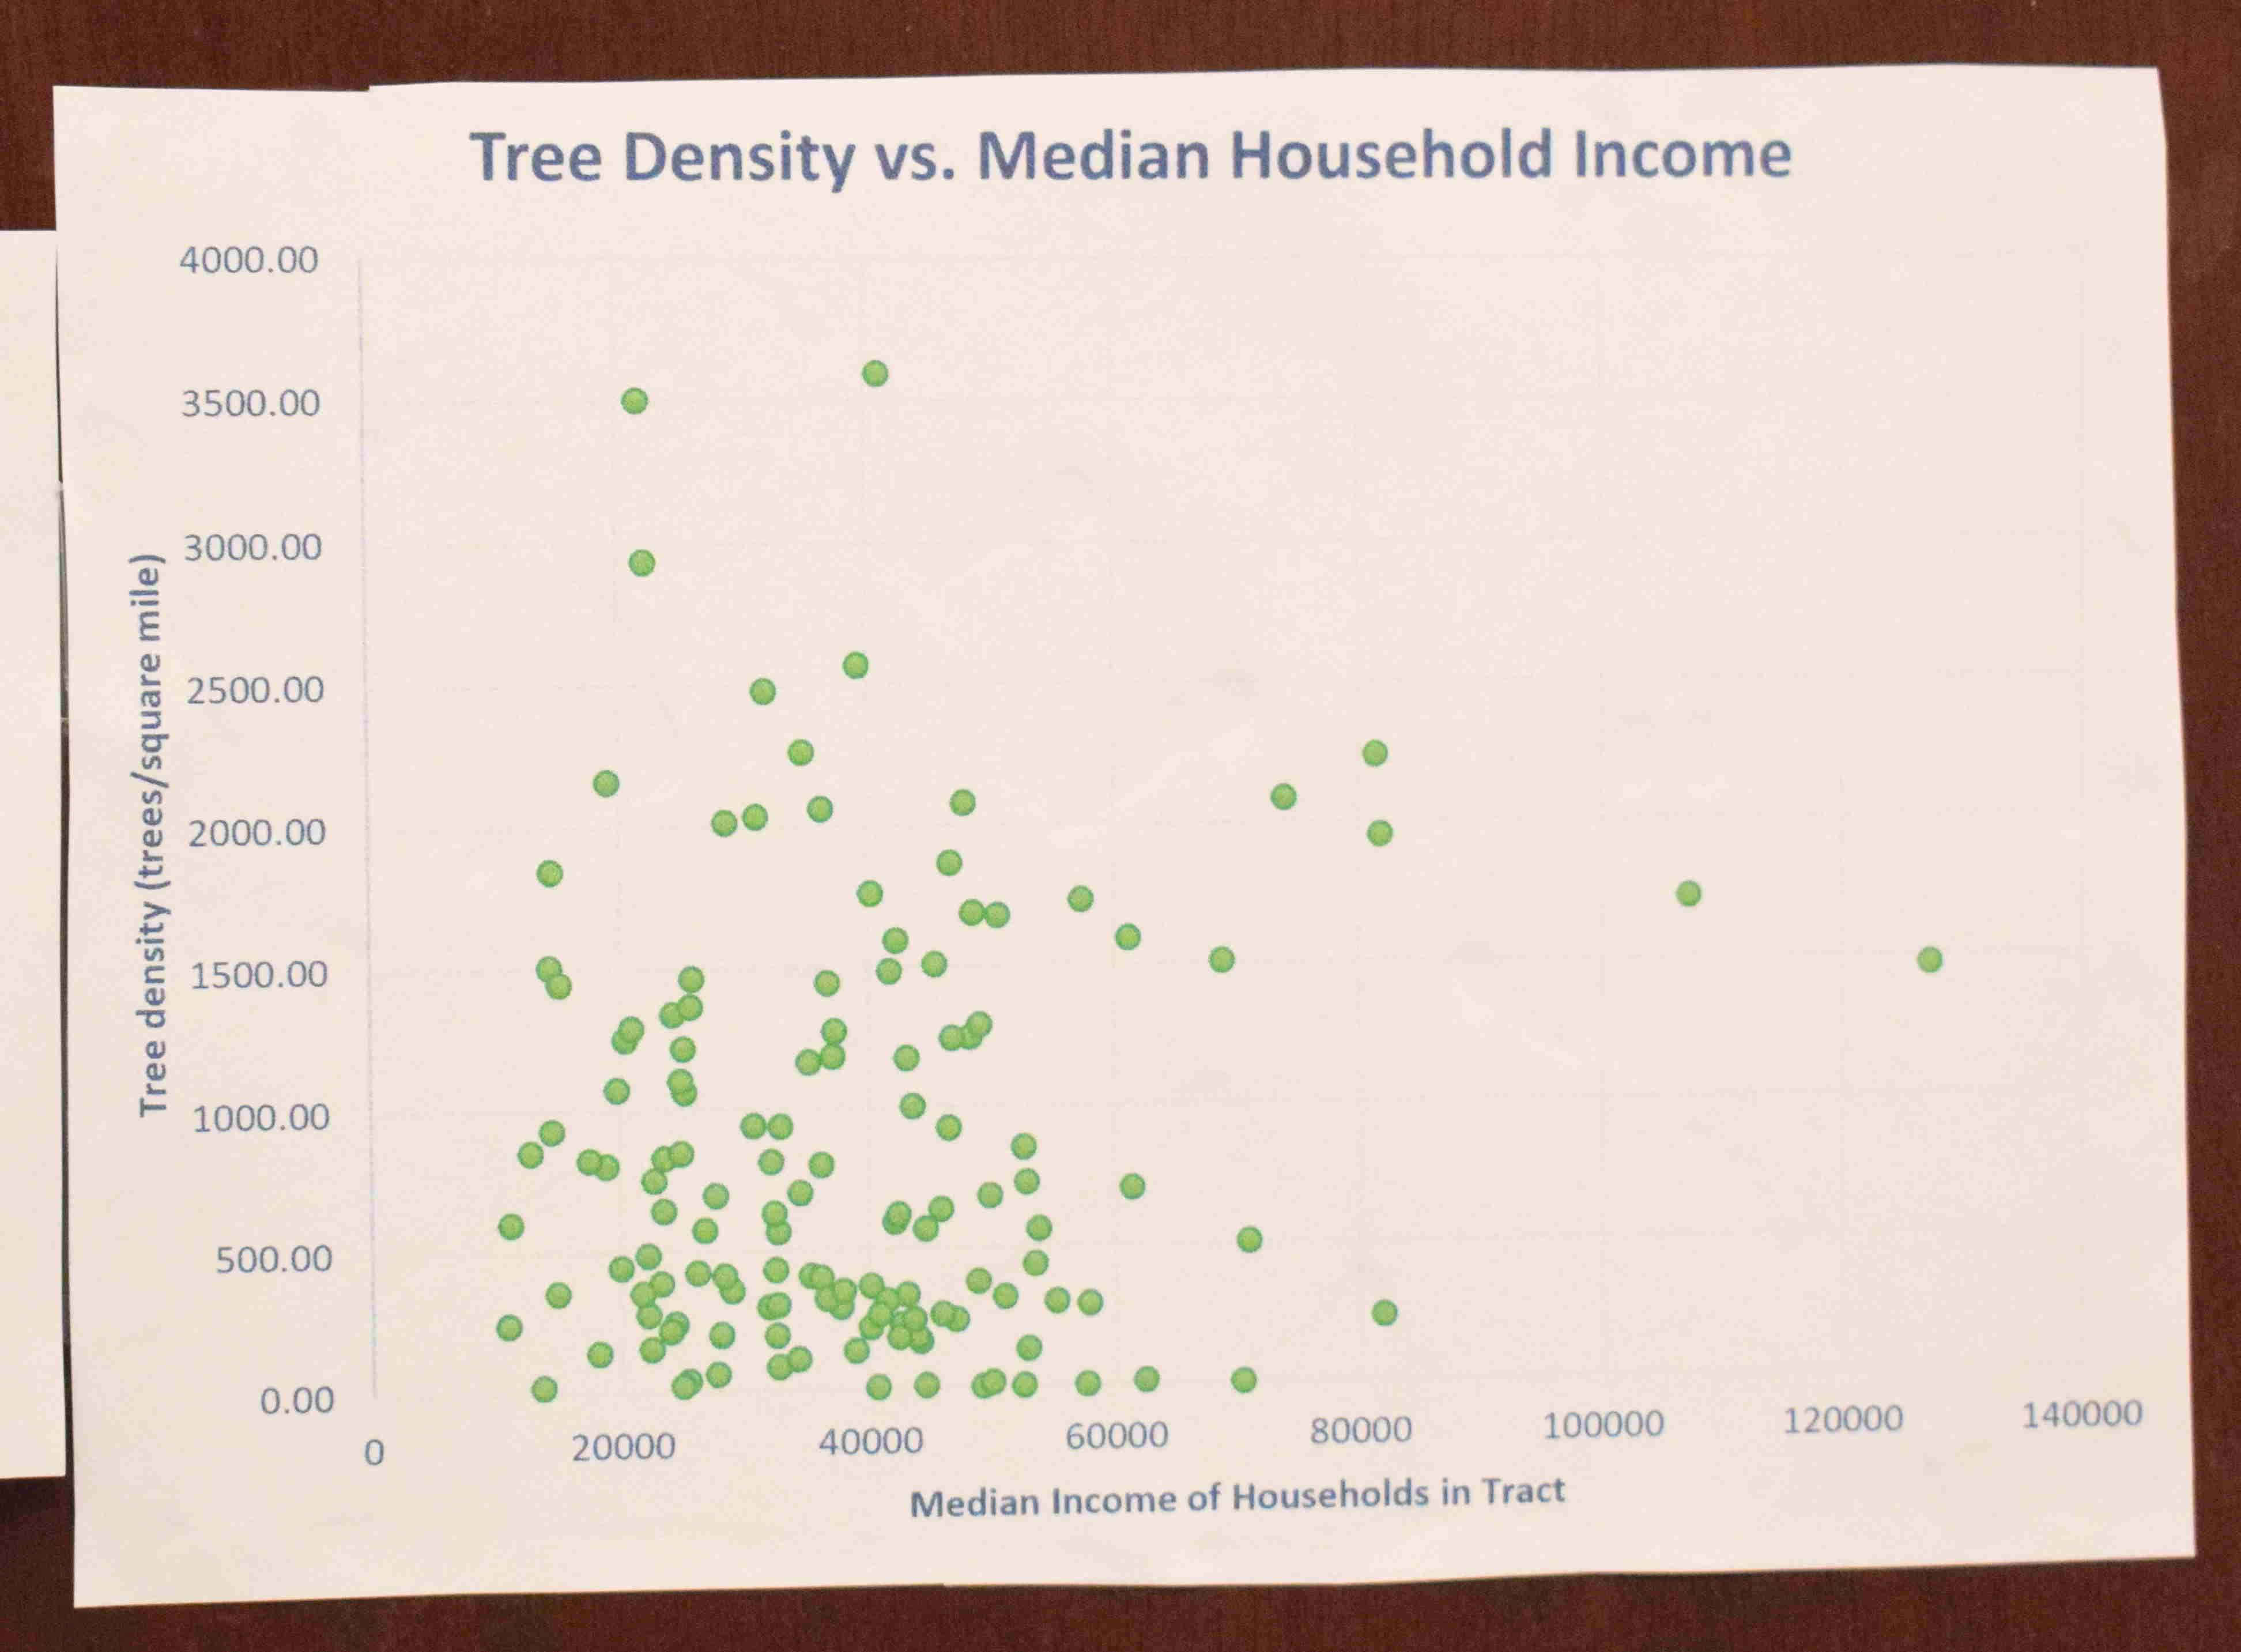
nature_peopleTrees! Socioeconomic status and city-managed tree distribution in Pittsburgh
local_cafeCoffee preference survey analysis
fastfoodMediterranean diet and chronic illness
local_librarySocioeconomic status and high school dropout rates
mapInternational development in Eastern Europe
my_locationGerrymandering in PA

local_hospitalVisualizing peer-reviewed Ketamine research graph data

languageCorrelating foreign language enrollment and difficulty levels
local_drinkToxic lead exposure in Pittsburgh
local_hospitalDrivers of opioid overdoses in Pittsburgh
local_librarySocioeconomic status and high school graduation rates
nature_peopleTrees! Socioeconomic status and city-managed tree distribution in Pittsburgh
Page created in 2019 by Eric Xander Darsow and all non-linked content can be freely reproduced without any permission or attribution according to the site's content use agreement. Any links to other content is governed by each page's respective usage rights context.