Master concept outline: Data analytics
Concept outlines specify the highest level categorization scheme for course content modules and documents wired together with hyperlinks to both content local to this server and across the web. It is designed to be an intermediary between course session schedules for DAT-102, DAT-201, and others (which are fixed to a particular segment of time) and topically orgnized assemblies of web-accessible content (which exist outside of a particular timeline segment).
Outlines such as this one also provide linkages bewteen the Technology Rediscovery implementation of a given course and learning objective classification schemes specified by the Community College of Allegheny County.
Data structures and representation
Inquiry process
Non-summary descriptive statistics
Computed descriptive statistics
Sampling
Sampling statistics versus population parameters
Databases
Toolchain building
Contents
Group A: Mean and median (MM)
iD.DS.MM.1 - Derive a data series' median, quartiles, and extreme values
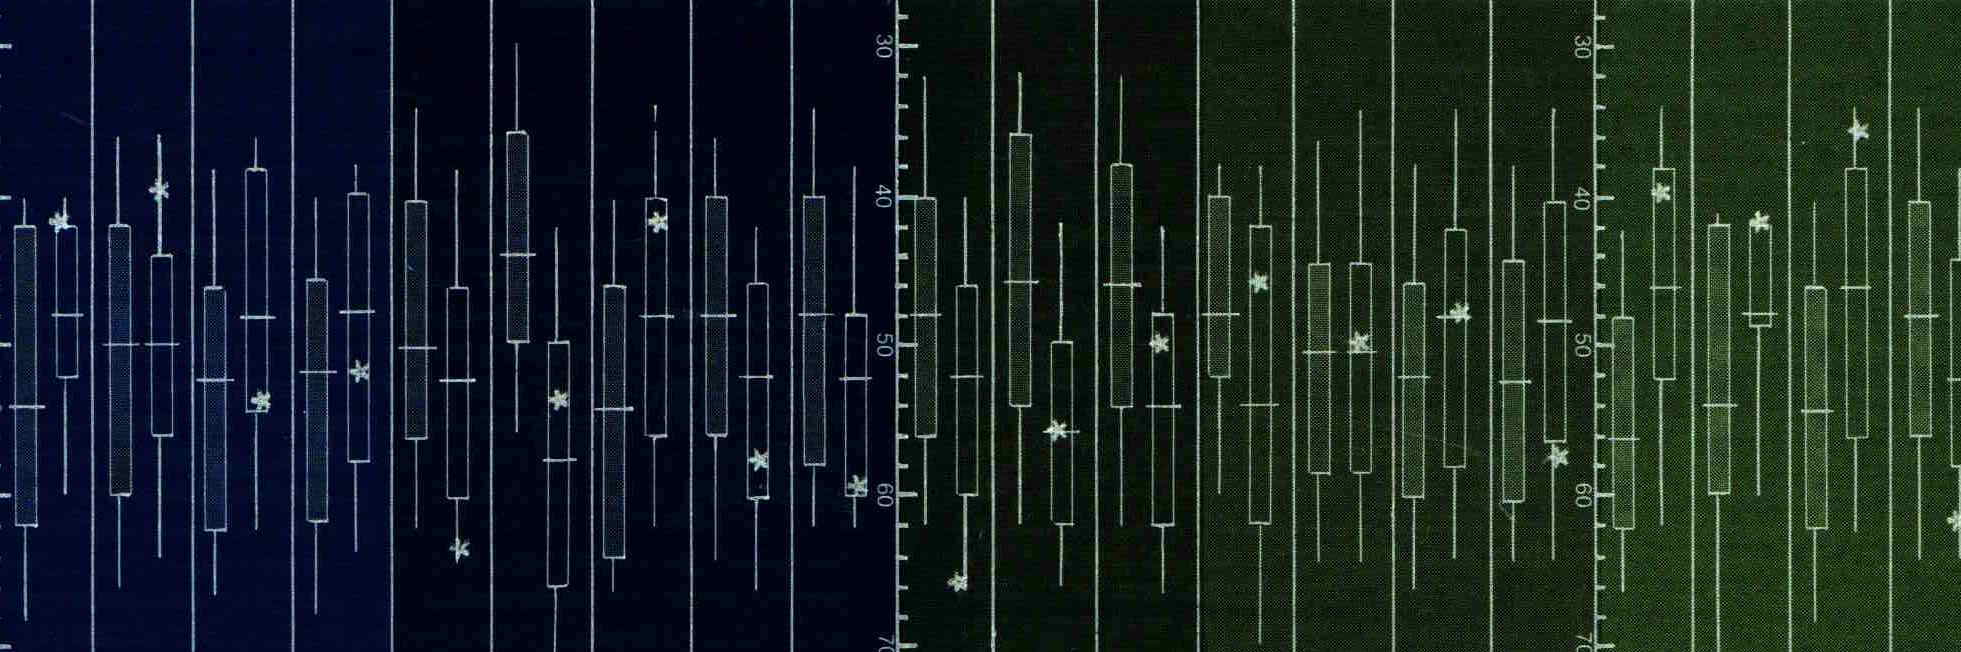
iD.DS.MM.2 - Generate a box box and whisker plot to describe a single, continuous variable
iD.DS.MM.3 - Compute measures of relative standing and interpret their values in context (e.g. percentile)
iD.DS.MM.4 - Compute a variable's mean by hand and with a spreadsheet
iD.DS.MM.5 - Deduce the differences in "shape" of a given pair of continuous variables using the relationship between their medians and means
Group B: Standard deviation (SD) and distributions
iD.DS.SD.1 - Define distribution and differentiate it from a bar chart
iD.DS.SD.2 - Compare the histogram of related variables using measures of modality, center, and spread
iD.DS.SD.3 - Compute a variable's standard deviation by hand and with a spreadsheet
iD.DS.SD.4 - Compute the z-score for each observation in a given data series by hand and with a spreadsheet
iD.DS.SD.5 - Apply the empirical rule concerning bell-shaped curves to evaluate the rareness of a given observation. State its limitations.
iD.DS.SD.6 - Perform and document an outlier analysis on a given data series, using each observation's z-score in your determinations
Group C: Culminating (C) exercises
iD.DS.C.1 - Exercise: Leverage descriptive statistical information to reunite jettisoned dataset profiles components
iD.DS.C.2 - Assemble and share polished quantitative variable profile of a variable whose values you generated
iD.DS.C.3 - Compose and share a quantitative variable profile of a variable from a secondary source, such as the Allegheny County property assessment
Group A: Non-summary stats
codeD.DS.A.1 - Median & quartiles
learning objective(s) |
D.DS.A.1: Compute the min, max, mode, median, and quartiles of a single data series by hand (i.e. not using a spreadsheet formula or data summarization tool in a data analysis package) |
resources |
Connected course content
Descriptive statistics is introduced in DAT-102 with this whole-group, multi-step project of exploring frequency distributions.

code Group A: Non-summary descriptive stats - Median, quartiles, whiskers, etc.
- codeD.DS.A.1 - Median & quartiles: Compute the min, max, mode, median, and quartiles of a single data series by hand
- D.DS.A.2 - Box-and-whiskers plots: median, Q1 and Q3, lower fence, upper fence, lower whisker end, upper whisker end and ii) creating correctly scaled box-and-whisker plots with the computed metrics
- D.DS.A.2 - Percentile conversion: Given a
Group B: Summary/Computed descriptive stats - Mean, & variance

Group C: Frequency distributions
Group D: Adroitly interpreting summary stats - Skewness, outliers
prerequisites |
None! |
program specification |
This is a motorcycleExercise 1: "Might we be friends?" flowcharting activity paragraph This is a paragraph |
|
|
This is a link to nowhere |

Page created in 2019 by Eric Xander Darsow. Original content can be freely reproduced without any permission or attribution according to the site's content use agreement. Any content accessed by links to external sites or content with specific rights notices is governed by its respective use agreements.