
Capstone data project guide
listContents
Policy analysis project framework
Overview screen cast recording
Project tracker
Datasets and research examples
Specification
wb_incandescentProject Framework
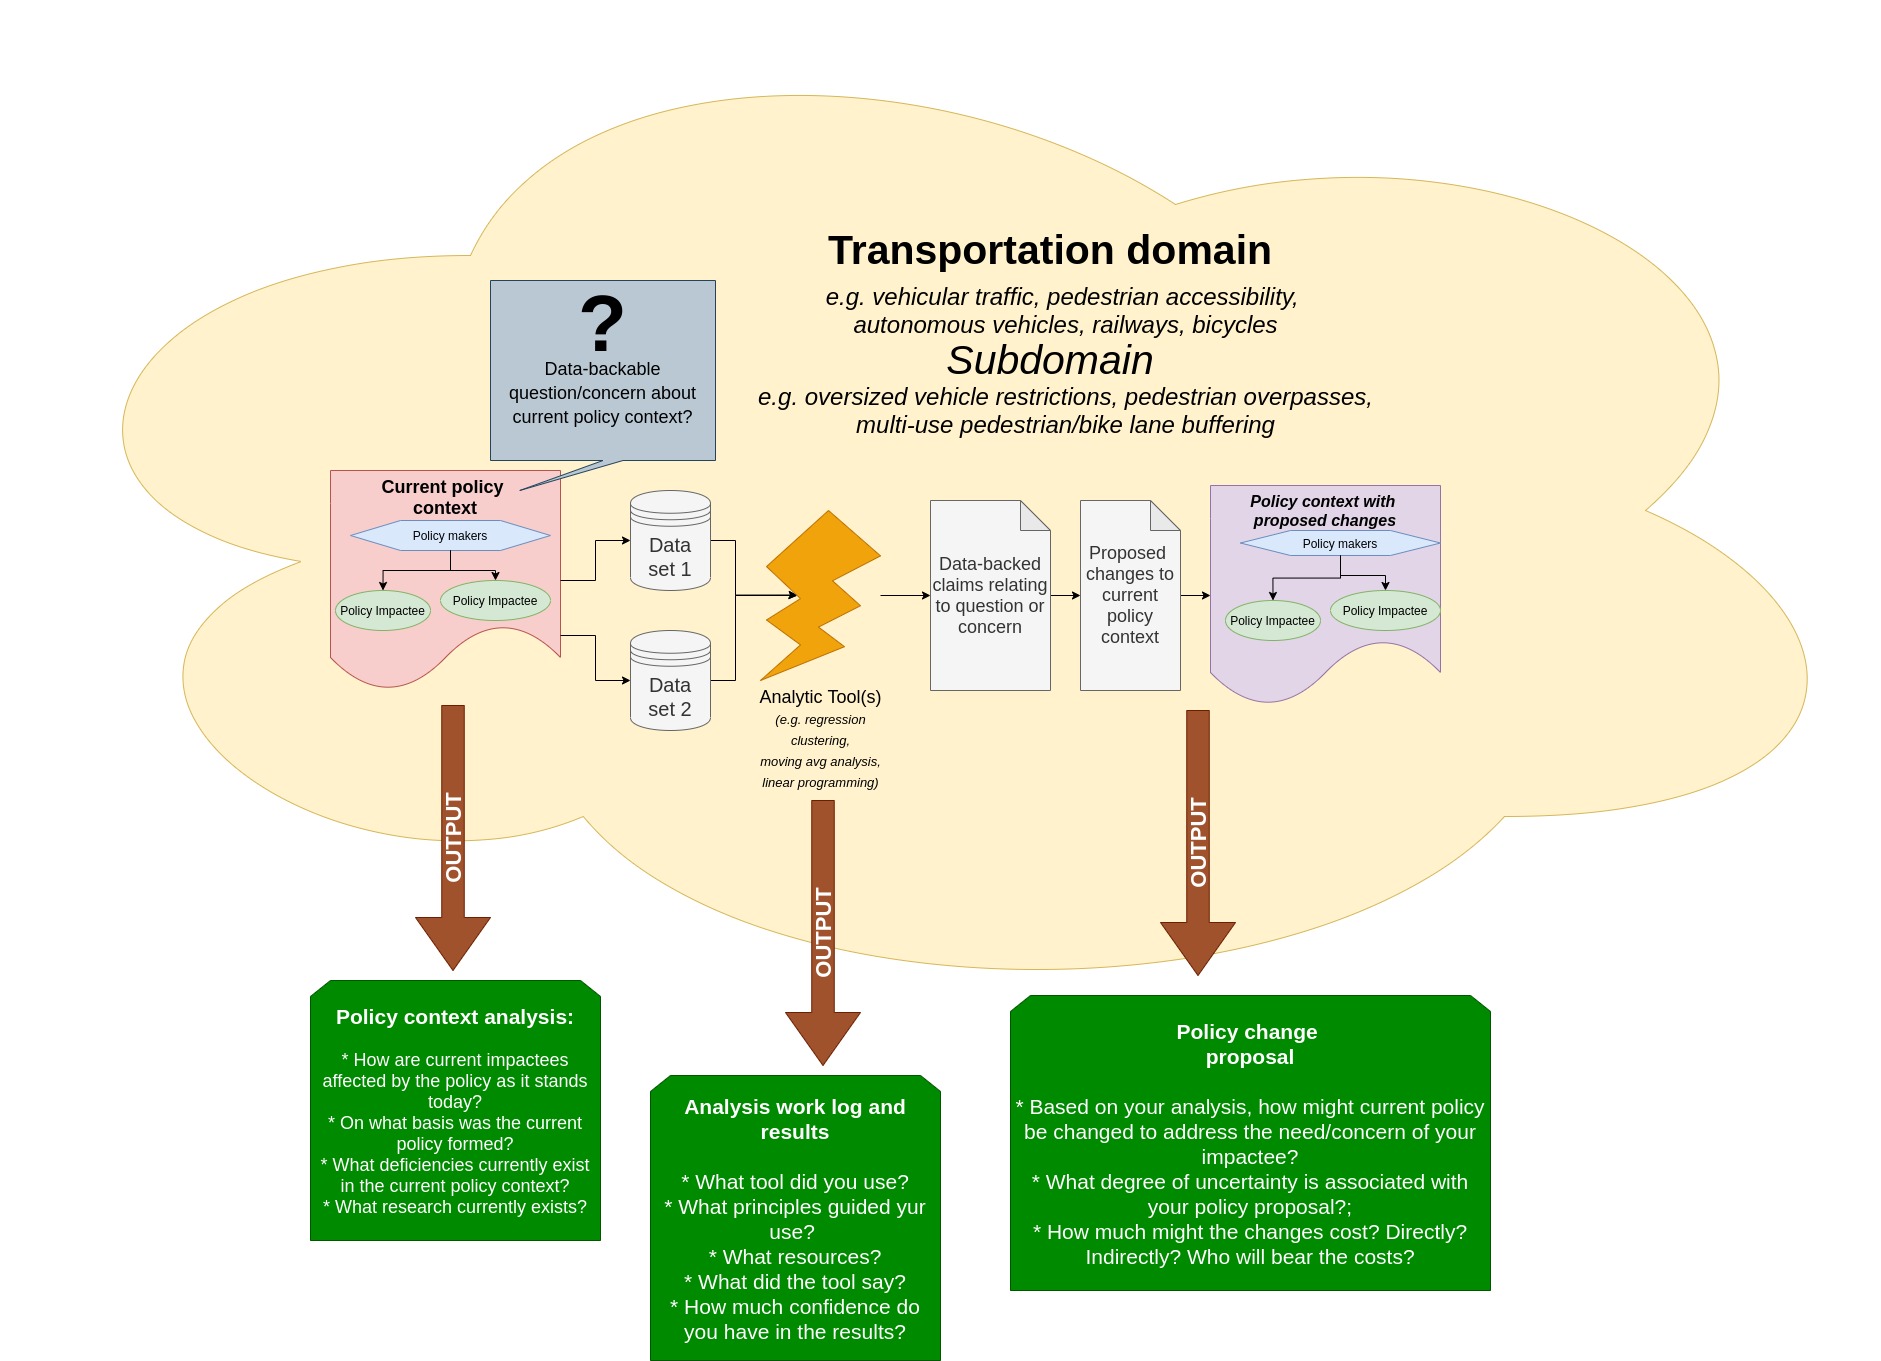
Sample impact analysis for oversized vehicle policy
- To what degree does adherence to the over sized vehicle policy reduce risk to non-truck drivers?
- Truck companies are impacted by fee costs, logistical restrictions
- Law enforcement: Must enforce rules, must be trained
- What are opportunity costs associated with policy implementation (opportunity cost = value of the next best alternative that is not chosen
- Taxpayers: Road maintenance costs increase as policy adherence decreases
Screen cast recording
The following video is a recording of the screen capture taken during the presentation of the alternative capstone project framework.
wb_incandescentProject tracker
wb_incandescentFeatured datasets and resources

bookProject specifications
The following table can be a starting point for project design and should be considered "negotiable" and flexible to address variations in project structure that make such inquiries rich and interesting.
project objective |
Explore a novel question related to transportation by processing and analyzing one substantial or multiple smaller datasets in python or R for presentation to an academic audience |
spec 1: novel question |
Develop a compelling and relevant question whose exploration requires rigorous data analysis. The question should speak to a concern of one or more entities or groups involved in the national or global transportation system. |
spec 2: background research |
Conduct a thorough literature review of academic research related to your chosen research question. Write a thoughtful summary of the existing literature drawing from academia (peer-reviewed journals), government reports, and agency studies. The review should cite and summarize 6-10 substantial sources related to your topic which together position your question amidst existing work on your question and its larger subject of inquiry. |
spec 2.5: solidify data set |
Either create, acquire, or assemble a data set (perhaps from multiple sources) on which your analysis can be conducted. |
spec 3: analysis |
Use python or R to assemble your data sources into analysis friendly formats, such as a CSV or relational database. Undertake exploratory analysis of each variable of concern, generating a descriptive statistical summary of each field (min, max, median, mode, mean, stdev). Choose a dominant analytic tool for pursuing your question, such as min/max analysis, linear regression, classification, clustering, or the like. Secure a primary reference resource for your tool of choice and digest it thoroughly. Read studies which apply your tool to a similarly "shaped" dataset. Undertake iterative analysis, trying variations of your analytic model and comparing the value of the results using your chosen tool's standard for comparison (e.g. r-squared for regression). Document your findings. |
spec 4: visualization |
Generate compelling visualizations of your analytic tool's output using a spreadsheet, pandas, or tools in R. Write detailed captions to accompany every figure such that a person unable to discern relevant patterns unassisted can glean the heart of your findings by reading only the captions to your figures. Compose short--but meaningful--written summaries of the following:
|
spec 5: sharing |
Assemble your work into a sharable form using any medium except a slide deck (i.e. "a Powerpoint"). This could be a tableau workbook, an R-Shiny interactive web tool, a website with embedded javascript, or a video presentation. Your chosen tool should be publicly accessible and free of glaring errors or bugs. |
arrow_upwardback to schedule