2-FEB'21

2.Attemp an install of the "most stable" desktop version for your OS. Keep track of bugs, look them up online if you can
9-FEB'21
Map Feature Discovery Exercise Review
Spatial data types
KML
ESRI Shapefile(s)
Compare map extents using conversion algorithms for various coordinate systems
Edit a KML file containing spatial data and demonstrate fidelity to the KML standard by displaying the KML data on a map
QGIS Setup Basics
Add kml file
- Layer menu bar - add layer - add vector layer - then choose your kml file - add
Install baselayer plugin
- Menu bar: Plugins - Manage and install Plugins - Search for QuickMapServices - select it from the search results - click "Install Plugin"
- Once the plugin is installed, you'll get a side panel, probably defaultingn to the right side of screen. If you don't see the plugin search window, navigate to View - Panels - QMS Search
- You could search for something like "street" and see a bunch of street layers
Layer Styling Basics
- Navigate to wprdc.org and browse data sets that are of type: KML or geoJSON. Download a few that look interesting.
- Add to a QGIS project
- Rename layers logically
- Choose styling to make features stand out from the basemap
- Practice reordering or changing symbols to allow several feature layers to coexist happily.
- Take a screen shot of your tinkering and upload to our shared one drive directory, inside the week2 sub-directory. The root is linked below.
16-FEB'21
Map projections and Intro to QGIS
Question: What types of distortion of map features occur as projection systems change? What evidence demonstrates these distortions?
- Open google Earth and create a test set of about 6 polygons of rectancular and triangular shape which span different axes of the earth. So we want some test features that travel across 1/4 or more of the earth's surface, some extended horizontally parallel with the equator (cutting lines of longitude) and some extending vertically cutting many lines of latitude.
- Once you have your chosen test shapes, export the file as a KML and upload to your group's directory in the cloud drive.
- All other group members can then download the test file for use in QGIS
- Each Member: Create a new project in QGIS named ProjectionComparison
- With your group, choose 6-8 different projection systems for your project using: Project >> Properties >> CRS tab >> Predefined CRS
- Look for naming patterns in the CRSs listed and choose from a variety of different core types, using the filter tool to shave down to a certain type of projection, i.e. "Cylindrical" or "Conic"
- Create a recording system--perhaps a Shared word doc in OneDrive--where you can experiment with projecting your features using several Coordinate Reference Systems in QGIUS. We want to caputre with screen shots the outputs of various projections with some simple explanatory text about what you're seeing.
Target completion for next week 23-FEB
Research the key features of the projections you choose to analyze to add depth to your conclusions;
23-FEB'21
Session Recordings
QGIS Demonstrations
Use vector analysis tools to count points by polygon, generate new quant attibutes, and style feaures based on feature attributes
Choose a polygon and point layer to conduct a similar type of analysis as we did with the trees by neighborhood. Distill down an inquiry question to pursue and see if you can style your map with that inquiry in mind. Tinker with the Choroplet shading algorthms (equal count, natural breaks, etc.) Take a screen clip of your map and upload to our shared drive: week4_pointsInPolygons directory.
2-MAR'21
Spring'21 Session Recording
Join flat file US census data with TIGER shapefile spatial data and create choropleth maps to investigate an inquiry question of your choosing.
Develop a (rough) inquiry question related to the spatial patterns in US census/ACS data, such as: Where in PA is the gender wage gap the greatest in construction and human services industries?
- Choose a region of interest to you, perhaps a whole state, or just a sub-section, or just blocks in a county.
- Choose a table using American Fact Finder that speaks to your inquiry question. Download that table, clean it up keeping only columns of interest to your inquiry. Don't forget to organize your data sets and don't just dump everything in Downloads.
- Load your spatial data into QGIS. Load in your flat file as demonstrated. Try the join on the GEO-ID column.
- Use the field calculator tool to generate a computed field related to your inquiry, such as subtracting male wages from female wages
- Visualize your data using sensible styling to draw the eye into your pattern of interest.
- Upload a screen shot and brief description in a text file of the patterns you discovered to our shared cloud drive week5 directory.
9-MAR'21
Recordings
QGIS and Map Layouts
Tool demos
- Intersection: vector >> Geoprocessing >> Intersection. This acts like a "cookie cutter". Be sure to create a new file for your layer and not a temporary layer.
- Export selected features only: use edit >> select and click on features you want to export (click with ctl for multi-select). Then, right click your layer in the layer pane, export >> Save Selected Features As...
- Use Vector >> geoprocessing >> clip to trim points inside a polygon layer
- Dissolve polygons to get an "outline" shape: Vector >> geoprocessing >> dissolve. You can dissolve on a categorical field value if your dataset supports it (i.e. the features are classified based on a category set)
Create map layouts with supporting features: legend, title, source, insets, etc.
- Develop or intensify a inquiry question using US Census/ACS data, ideally comparative in nature. Possibly side-by-side maps of compared areas in your layout. Declare you intent in our tracker
- Use joins and processing tools to trim your data and symbolize your maps as appropriate.
- Export your layout as a PDF or JPG and either post to a git repo or cloud drive. Prepare to share next week!
16-MAR'21
Recordings
Vector Layer Analysis
- Buffers and area overlap analysis
In-Class Exercise Steps
- Create a blank project called busAccessZones in QGIS
- Retrieve the Port Authority bus route layer from the WPRDC.org
- Lets secure contextual layers for identification of regions with poor bus coverage, so perhaps Pittsburgh Neighborhoods
- With your blank project, click prohject >> properties >> CRS and choose a projected coordinate system, such as the: WGS_1984_Web_Mercator_Auxiliary_Sphere
- Let's inquire which neighborhoods have the least to access to rapid, express, and key corridor routes. TO do this, let's select only these types of features in our route layer. Open the attribute table. Then click the column header for serviceType to sort by service type. Hold down control and control + shift to select only these three types of routes
- With only our rapid, express, and key corridors selected, right click the layer in the layer pane, export >> export selected features >> and name the file logically.
- Create a polygon buffer around all of our Port Authority routes: Vector >> Geoprocessing tools >> Buffer. Once in your tool popup, select the Port Authority routes as your layer, and set buffer distance to 0.25 miles.
- Consider turning on a base layer with the Quick OSM plugin: Eric used the ESRI World Topo base layer.
- We now want a new polygon layer of only the neighborhood areas that are not within 1/4 mile of an express, rapid, or key corridor route. Create this with vector >> Geoprocessing tools >> Symmetrical Difference tool.
- In our case, since the bus routes extend beyond PGH city limits, we need to clip the low-service area symmetical difference layer to only the extent of PGH Neighborhoods. Do this with vector >> geoprocessing tools >> clip
- Style the result layer and add supporting layers, such as neighborhood centers, etc.
TODO for week 7
Use the buffer tool around a point, line, or polygon layer of your choice to investigate the impact of the some attribute of your chosen layer on the surrounding area. For example, one idea would be to look for so-called food deserts by creating a buffer of walking distance around known supermarkets. Another idea would be use the recreation layers in the WPRDC, such as playgrounds, ball fields, green fields, etc. Investigate the question of which areas in a given study area have the most access to child-friendly spaces. Create a buffer of safe child walking distance to playgrounds, pools, or recreation sites and identify low-service areas (less ideal areas to raise children who want to play).
Create a simple map layout and upload to the week7_buffers shared drive subdirectory.
23-MAR'21
Recording
Applied spatial algorithms
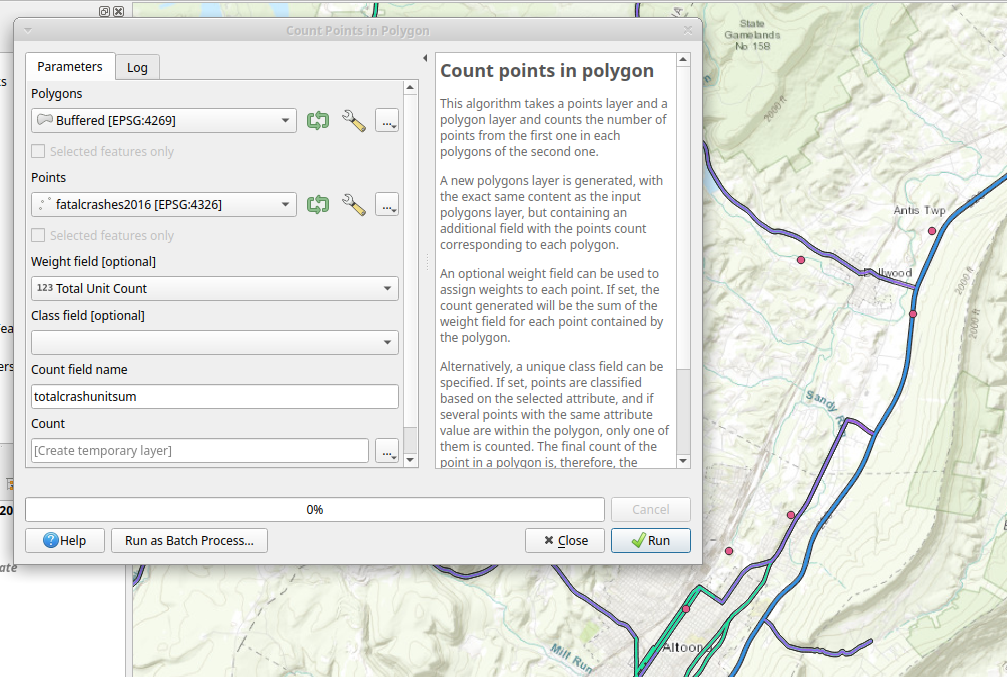
PA Crash Data setRoad Safety mini-projecet
Which sections of road in PA do you classify as most dangerous? Which sections of road are good candidates for increased safety implements such as lighting, guardrails, speed tracker signs?
Suggested steps: Review the PA Crash data points to decide which ones to use in your analysis. Build a map with a reasonable buffer around PA roads such that crashes can be counted with the "Count points in polygon" tool as demonstrated tonight and previously.
Helpful notes
- Eric's PA road buffer is stated in degrees, so his 200 foot buffer was encoded as 0.000549 degrees inside the buffer tool.
- Eric used the weight field in the count points in polygon tool to add additional data depth to the analysis. See tool settings.
For post-spring break
Prepare a draft export of your map and also a short written summary of your findings for sharing with peers on the class after spring break. Upload your images to our week8_roadSafety shared drive
30-MAR'21
6-APR'21
Session Recording
Digitizing 311 Service Zones Project
Strategically create vector features on a map based on patterns discovered in supporting data sets. Use generated features to continue pursuing spatial inquiry.
Completion target for 311 vector project: Class start of 20-APR-2021
13-APR'21
Session Recording
LandSat 8 Primer and Raster Data
Project Worktime
Download and symbolize raster data from the USGS LandSat 8 sensor array
Finalize your 311 service zones and create a presentable set of map layouts which depict your suggested priority zones for the City of Pittsburgh Department(s) which you chose to analyze.
20-APR'21
Session Recording
311 Project Sharing
Prep postgreSQL install
- Mop up any last changes/finishing items on your 311 project. Don't forget: please try creating a polygon or two of your own custom shape
- Install PostgreSQL on your local system with this install link OR figure out how to wire up a remote postgres to be accessibl to your local network adaptor.
- Note on versions: Most current version is great: currently at 13.2
27-APR'21
Session Recording
Final project planning
"Stake in ground" for final project
Procure/secure a primary data set on which you can investigate your key inquiry question. ONce you have set, try loading it into QGIS and getting basic distribution patterns.
4-MAY'21
Recording
Network Data Module
Not to be: Spatial Databases
- PostgreSQL basics
- PostGIS extension installation
- Connecting to PG Admin
- Spatial query visualization
Final project Q&A worktime
Git essentails review
Use an algorithm to compute the shortest path from point A to X.
Complete final project using guide
11-MAY'21