Inference through sampling
wb_incandescentIntroduction
Sampling allows us to make inference about a parameter such as the mean that describes a larger population. The mini-projects in this section will invite you to experimentally explore the relationship between sample statistics and population parameters.
bookSampling learning resources
The following resources will anchor our project academically:
1. Lock^5 Textbook:
The following sections of our official textbook, the Lock family's Statistics: Unlocking the Power of Data, treat sampling, and inference using confidence intervals and P-values
- Chapter 3: Confidence intervals, sampling distributions, and the bootstrap technique
- 3.1: Parameters vs. Statistics
- 3.1: Point estimates of population parameters
- 3.2: Sampling distributions
- ex. 3.18: Common misinterpretations of confidence intervals
- 3.3: Constructing bootstrap confidence intervals
- Chapter 4: Hypothesis tests, measuring evidence with P-values
2. The Locks family on tape: Intuitive approach to confidence intervals
3. Statistics on Libre Office by Dana Lee Ling
This excellent free online book is built on open source Libre Calc and contains compact presentations of core statistics concepts.
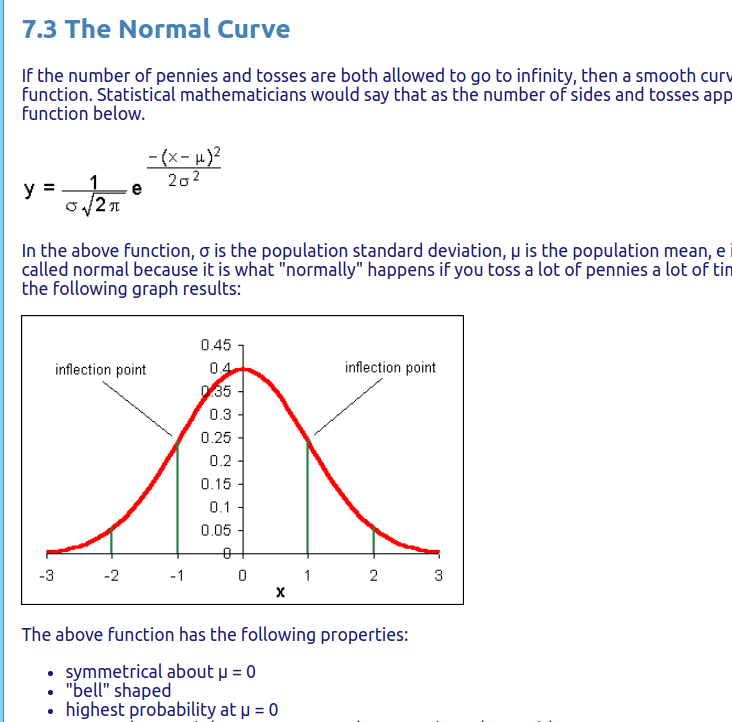
Normal distributions and sampling
bookCore Concept A: Population versus samples
bookCore Concept B: Confidence intervals
Mini-project 1: Interpreting confidence intervals
Mini-project 2: library book sampling
Shared drive for library upload

Library of congress classification scheme
Spring 2019 Results


Mini-project 3
bookAnalysis Steps
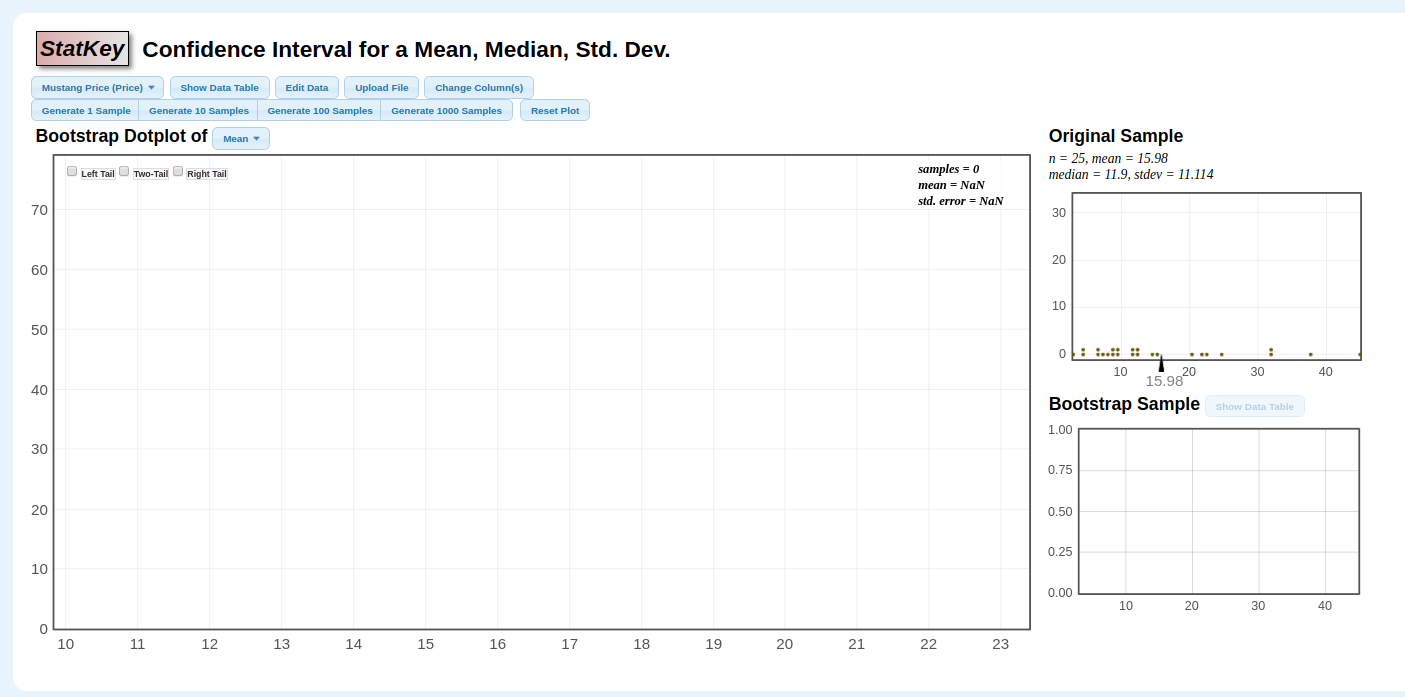
Step 1: Load variable data into statkey
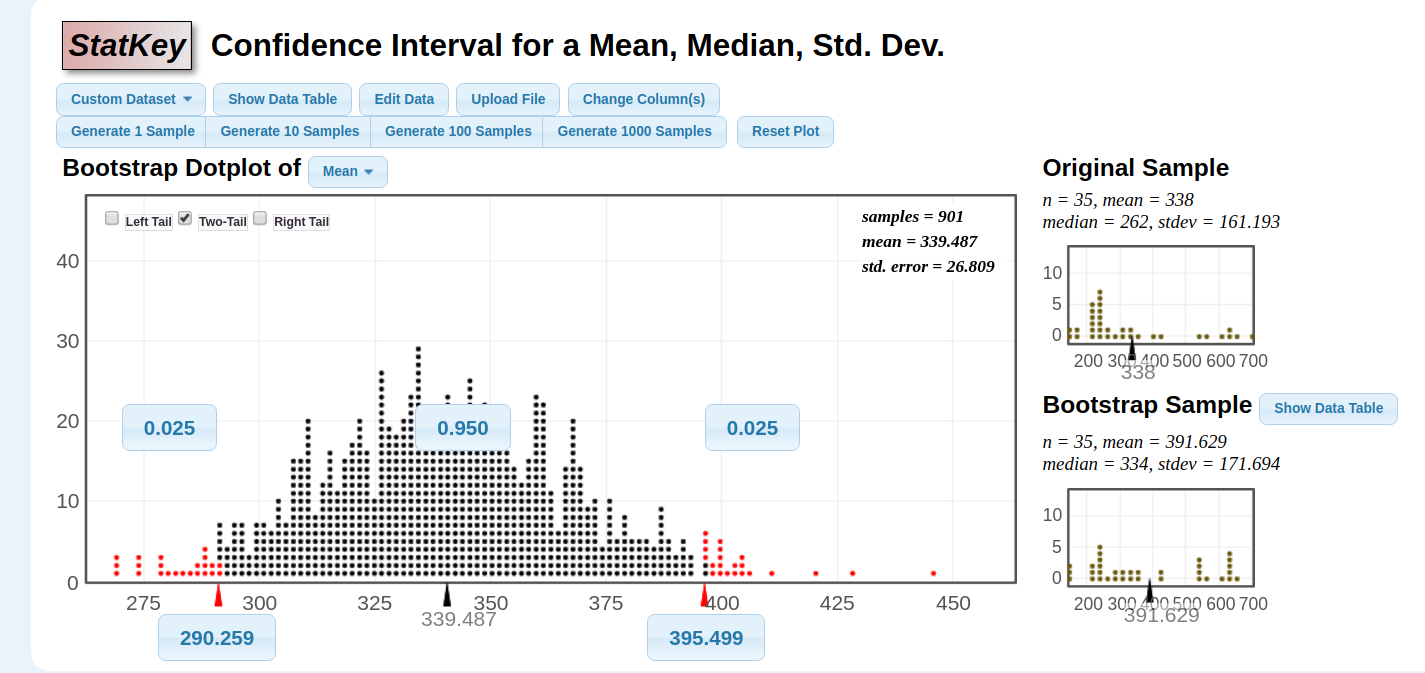
The 95% confidence interval is (290,395) around our point estimate of 339 pages. Width of 105 pages.We believe that if we repeatedly sampled 35 books from the JK section, we would expect about 95 out of 100 of these samples to "capture" or include the true population parameter i.e. the actual average number of pages of all books with a LCCN prefix of JK.
If I'm willing to accept a lower confidence, of 80%, my interval is only (306, 374), with a width of 68 pages. We would expect 80 out of 100 repetitions of this sample to include the true population value.
Unfortunately we cannot know given our current experimental structure if our single sample does in fact capture the true mean.
The central tradeoff we face:
If we wish to speak about the population mean with more PRECISION (smaller confidence interval) we must accept a LOWER CONFIDENCE rate (i.e. we would expect fewer samples, if repeated, to capture the true population value)