CF3 Module 1: Stealthy Observational Research
Parent Component: Computer Fundamentals-Data In Spreadsheets
Computers are great at storing and manipulating structured data--meaning information that is organized in a consistent way. Many great tools exist for sorting through, finding patterns, and presenting structured data. This module explores the process of creating a data schema (structure), gathering data using that schema, processing, and finally analyzing that data in a spreadsheet.
The data we'll gather is field data meaning that the measurements we make concerning consumer behavior take place "in the real world", in our case in a major retail outlet, such as WalMart. This process will create a realistic data scenario in which data must be cleaned, validated, and then questioned for trends and conclusions.
Jump to a section
Module "hamburger" guide
Learning Objectives
Core Concepts
Resources and reference documents
Appetizer:
Module Preparation Exercises
Exercise 1:
Exercise 2:
Mini Project:
Extension Exercises
Module Hamburger Guide
Print off the hamburger guide for this module, review it carefully, and complete its sections as a culminating activity for this module.
When your module is in ship-shape, fold the module page "hamburger style" and slide all of your module documents inside. Place the whole hamburger into the right pocket of your folder for review.
CIT 100 Hamburgers
Computer Fundamentals 2 (CF2): Hamburger (*.pdf)
Computer Fundamentals 2 (CF2): Hamburger (open document text *.odt)
CIT 115Hamburgers
Computer Fundamentals 2 (CF2++): Hamburger (*.pdf)
Learning Objectives
- Formulate research questions related to consumer behavior that can be explored using quantitative (numbers) and categorical data. Generate a set of hypotheses related to these questions.
- Design a data schema (structure) in a spreadsheet to capture data related to the research questions. Create a data dictionary and field data gathering guide to accompany that schema.
- Investigate trends in the consumer data using spreadsheet functions: sum(), average(), sumif(), correl(), stdev()
- Visualize finding from the field data using various kinds of charts and draw conclusions about initial hypotheses
Module Core Concepts
Creating a data schema (structure)
A data schema is a fancy term for a plan for organizing data, usually this involves creating a data table in a spreadsheet. Let's imagine we are creating a data schema for organizing information about CCAC students academic and career interests. We'll walk through the process of creating a schema for this information.
Step 1: Identify the basic unit of data
Data is always about something--a person, a thing, event, etc. A data schema depends on identifying only one of these things to record information about in any one data table. In our case, we are recording data about individual students. We could say our data unit is a single student.
Step 2: Formulate a research question that your data can illuminate
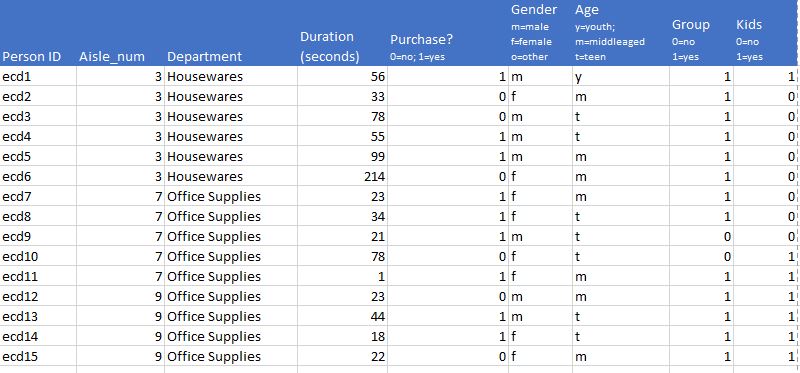
We gather data not for the sake of creating more spreadsheets, but rather to learn something about the world. As you design your experiment, brainstorm 1-2 research questions that you data should be able to offer some insight into. What if we plan on collecting data about how long folks shop in a department and various observable characteristics of those people. A sample data table is:
Let's look at some examples:
- Do male shoppers in housewares shop for less time than female shoppers, on average?
- Do folks who spend relatively more time in a department buy something at a higher rate?
- Are kids associated with more or less likelihood of purchase?
Step 2: Setup the general table structure
Once we have a basic unit of data for our table, we are ready to start assembling our data table. As a general rule, the data units each get their own row and each must be identified uniquely from among all the others--this is usually accomplished through a unique identification number.
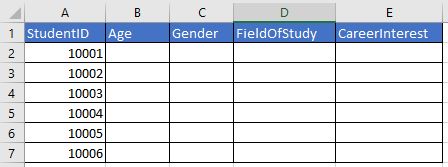
We've decided our data is about students, so now we have to decide what about each student are we recording. Each piece of data we are capturing about each student is placed in its own column in the data table. We might want to know each student's age, gender, field of study, and career interest.
We're now ready to assemble our skeleton data table:
Step 3: Populating our data schema
The structure of our data is now clear: students down the rows, stuff about those students in individual columns. Note that one should avoid using spaces or strange characters (such as $ ? % & &) in the column headers. This helps avoid errors when moving the data from one format to another, or from one application to another.
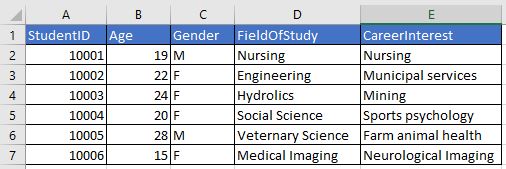
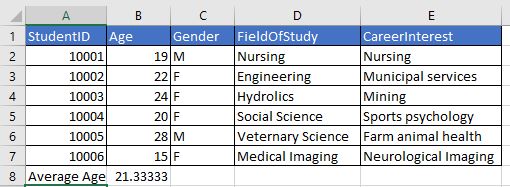
We can gather data many ways: sometimes it's all ready for us and we can just copy it in place and off we go. If we're gathering data ourselves, we'll need to follow a consistent approach to collecting and entering that data to avoid errors in our data. Let's imagine we are able to glean this student data from the CCAC registrar and there are no missing bits of data, and the format of each piece is consistent. Here's our populated table:
Step 4: Manipulating our data to gain insight into our inquiry questions
Once we have an assembled data table, we can use a variety of tools to manipulate that data to arrive at answers to any questions we might have about the data. For example, if these students are all in CIT 100 together, a simple question would be: what is their average age? We can use an excel function called--of all things--average() to average the values in column B: student age.
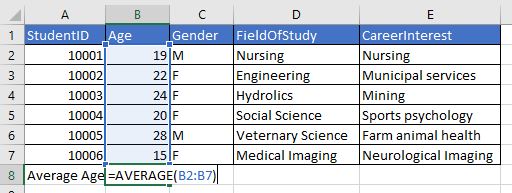
Once we have setup our function correctly to average all the numeric values in column B, we press enter and the average appears, which is about 21 years old.
External Resources
MS Excel 2016 documentation by Microsoft Corporation
The most useful resource for using any digital tool is usually the documentation provided by the creator of that tool, in this case, that creator is the Microsoft corporation. This documentation gives specific instructions for using each formula and function, along with ideas for analyzing and visualizing data.
General MS Excel 2016 tutorials
GCF LearnFree.org provides a nicely organized set of tutorials with videos for navigating the basic components of MS Excel 2016
Exercise 1: Generate research questions realted to consumer behavior
We want to learn some interesting stuff about how folks shop such that we could make recommendations to retailers to better serve consumer needs. Or, perhaps better yet, raise questions about how consumerism is impacting our general psychological health. Possible questions might include:
- Do men or women spend more time looking for a given product?
- Does shopping with a partner make shopping take longer or does it encourage faster shopping?
- Are certain departments likely to encourage longer shopping excursions? Why might that be?
Exercise 2: Generate a data schema & gather data
We want to gather data to answer questions such as these:
- Create a new spreadsheet document. Create a column for each observation's identification number.
- Now add columns to the right of the first column to store data about various parts of the shopping experience.
- Check to make sure that your column headers have no spaces and no strange characters.
Module mini-project
Develop a small infographic showing some trends you found in your data
- Use a tool like MS Powerpoint, Pictochart, or google draw to create a neat looking chart.
Checkout a neat picktochart example
Extension activities
Exercise type:
Content
- Formulate another research question that you could answer with field-gathered data. Create a schema for doing so. Go gather that data, and analyze it with a spreadsheet. Publish your findings on social media.